
Compare Jay Shree Tea with Similar Stocks
Dashboard
With a Operating Losses, the company has a Weak Long Term Fundamental Strength
- Low ability to service debt as the company has a high Debt to EBITDA ratio of 22.96 times
- The company has been able to generate a Return on Equity (avg) of 3.54% signifying low profitability per unit of shareholders funds
The company has declared Negative results for the last 3 consecutive quarters
Risky - Negative Operating Profits
Consistent Underperformance against the benchmark over the last 3 years
Stock DNA
FMCG
INR 235 Cr (Micro Cap)
NA (Loss Making)
59
0.61%
1.05
-6.33%
0.59
Total Returns (Price + Dividend) 
Latest dividend: 0.4991142604074402 per share ex-dividend date: Aug-05-2025
Risk Adjusted Returns v/s
Returns Beta

News

Jay Shree Tea & Industries Ltd is Rated Strong Sell
Jay Shree Tea & Industries Ltd is rated Strong Sell by MarketsMOJO. This rating was last updated on 03 Nov 2025, reflecting a significant reassessment of the stock’s outlook. However, the analysis and financial metrics presented here are based on the company’s current position as of 14 July 2026, providing investors with the latest data to understand the rationale behind this recommendation.
Read full news article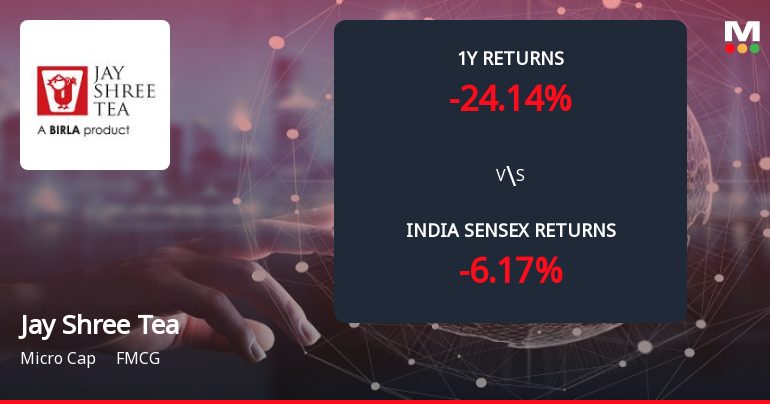
Jay Shree Tea & Industries Ltd Forms Death Cross Signalling Bearish Trend
Jay Shree Tea & Industries Ltd has recently formed a Death Cross, a significant technical indicator where the 50-day moving average crosses below the 200-day moving average. This development signals a potential deterioration in the stock’s trend and raises concerns about sustained bearish momentum in the near to medium term.
Read full news article
Jay Shree Tea & Industries Ltd is Rated Strong Sell
Jay Shree Tea & Industries Ltd is rated Strong Sell by MarketsMOJO. This rating was last updated on 03 Nov 2025. However, the analysis and financial metrics discussed here reflect the company’s current position as of 03 July 2026, providing investors with the latest insights into its performance and outlook.
Read full news article Announcements
Shareholders meeting
16-Aug-2019 | Source : NSE
| Jayshree Tea & Industries Limited has informed the Exchange regarding voting results of Annual General Meeting held on August 14, 2019 |
Financial Result Updates
14-Aug-2019 | Source : NSE
| Jayshree Tea & Industries Limited has submitted to the Exchange, the financial results for the period ended June 30, 2019. |
Appointment
14-Aug-2019 | Source : NSE
| Jayshree Tea & Industries Limited has informed the Exchange regarding Appointment of Mrs JAYASHREE MOHTA as Chairman of the company w.e.f. August 14, 2019. |
Corporate Actions

No Upcoming Board Meetings

Jay Shree Tea & Industries Ltd has declared 10% dividend, ex-date: 05 Aug 25

Jay Shree Tea & Industries Ltd has announced 5:10 stock split, ex-date: 13 Aug 10

No Bonus history available

No Rights history available
Quality key factors
Valuation key factors
Technicals key factors
 Technical Indicator Scale: Bearish, Mildly Bearish, Sideways, Mildly Bullish, Bullish Turned
 Shareholding Snapshot : Mar 2026
Shareholding Compare (%holding)
Promoters
None
Held by 0 Schemes
Held by 2 FIIs (4.86%)
Jayashree Finvest Private Limited (23.09%)
Ares Diversified (4.85%)
36.88%
Quarterly Results Snapshot (Consolidated) - Mar'26 - YoY

YoY Growth in quarter ended Mar 2026 is 10.00% vs 20.34% in Mar 2025
YoY Growth in quarter ended Mar 2026 is -208.58% vs 309.31% in Mar 2025
Half Yearly Results Snapshot (Consolidated) - Sep'25
Growth in half year ended Sep 2025 is -0.99% vs 13.70% in Sep 2024
Growth in half year ended Sep 2025 is -50.61% vs -22.89% in Sep 2024
Nine Monthly Results Snapshot (Consolidated) - Dec'25
YoY Growth in nine months ended Dec 2025 is 8.01% vs 13.75% in Dec 2024
YoY Growth in nine months ended Dec 2025 is -90.43% vs 239.22% in Dec 2024
Annual Results Snapshot (Consolidated) - Mar'26
YoY Growth in year ended Mar 2026 is 8.39% vs 15.59% in Mar 2025
YoY Growth in year ended Mar 2026 is -119.81% vs 873.90% in Mar 2025
About Jay Shree Tea & Industries Ltd

Company Coordinates


