
Compare Jay Ushin with Similar Stocks
Dashboard
Low ability to service debt as the company has a high Debt to EBITDA ratio of 2.97 times
- Poor long term growth as Net Sales has grown by an annual rate of 10.94% over the last 5 years
- Low ability to service debt as the company has a high Debt to EBITDA ratio of 2.97 times
- The company has been able to generate a Return on Capital Employed (avg) of 9.77% signifying low profitability per unit of total capital (equity and debt)
Healthy long term growth as Operating profit has grown by an annual rate 70.76%
Positive results in Mar 26
With ROCE of 8.5, it has a Fair valuation with a 1.9 Enterprise value to Capital Employed
Majority shareholders : Promoters
Market Beating performance in long term as well as near term
Stock DNA
Auto Components & Equipments
INR 348 Cr (Micro Cap)
19.00
36
0.44%
0.86
13.89%
2.75
Total Returns (Price + Dividend) 
Latest dividend: 4 per share ex-dividend date: Sep-19-2025
Risk Adjusted Returns v/s
Returns Beta

News

Jay Ushin Ltd Upgraded to Hold by MarketsMOJO on Improved Financial and Quality Metrics
Jay Ushin Ltd has seen its investment rating upgraded from Sell to Hold, reflecting significant improvements across financial performance, quality metrics, and valuation parameters. Despite some technical headwinds, the company’s robust quarterly results and enhanced operational efficiency have prompted a reassessment of its outlook within the Auto Components & Equipments sector.
Read full news article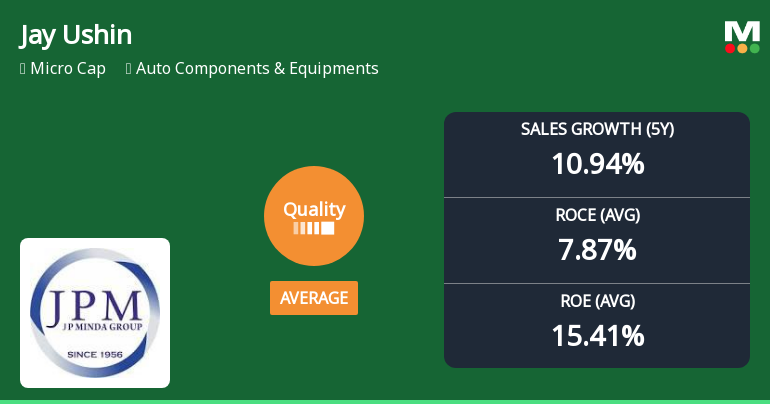
Jay Ushin Ltd Quality Grade Upgrade Reflects Improved Business Fundamentals
Jay Ushin Ltd, a micro-cap player in the Auto Components & Equipments sector, has seen its quality grade upgraded from below average to average as of 1 June 2026, reflecting notable improvements in its business fundamentals. This upgrade accompanies a revised Mojo Grade from Sell to Hold, signalling a cautious but positive shift in the company’s financial health and operational metrics.
Read full news article
Jay Ushin Ltd is Rated Sell by MarketsMOJO
Jay Ushin Ltd is rated 'Sell' by MarketsMOJO, with this rating last updated on 15 Apr 2026. However, the analysis and financial metrics discussed here reflect the stock's current position as of 30 May 2026, providing investors with an up-to-date view of the company’s fundamentals, valuation, financial trends, and technical outlook.
Read full news article Announcements
Announcement under Regulation 30 (LODR)-Newspaper Publication
30-May-2026 | Source : BSEPursunat to the Regulation 30 of SEBI (Listing Obligation and Disclosure Requirement) Regulations 2025 we are enclosing herewith a copy of advertisement for Audited Financial Results for the quarter and year ended March 31 2026 published in Financial Express (English Newspaper) and Jansatta (Hindi Newspaper). The Audited Financial Result for the quarter and year ended March 31 2026 was approved by the Board of Directors in its meeting held on May 29 2026.
Compliances-Reg.24(A)-Annual Secretarial Compliance
30-May-2026 | Source : BSEAnnual Secretarial Compliance Report for the year ended March 31 2026 enclosed
Announcement under Regulation 30 (LODR)-Newspaper Publication
30-May-2026 | Source : BSEPursuant to the Regulation 30 of SEBI (Listing Obligation and Doisclosure Requirement) Regulation 2015 we are enclosing herewith a copy of advertiesment for Audited Financila Results for the quarter and year ended March 31 2026 publish in Financial Express (English) and Jansatta (Hindi) newspaper. The Audited Financial Results for the quarter and year ended March 31 2026 was approved by the board of directors in its meeting held on May 29 2026
Corporate Actions

No Upcoming Board Meetings

Jay Ushin Ltd has declared 40% dividend, ex-date: 19 Sep 25

No Splits history available

No Bonus history available

No Rights history available
Quality key factors
Valuation key factors
Technicals key factors
 Technical Indicator Scale: Bearish, Mildly Bearish, Sideways, Mildly Bullish, Bullish Turned
 Shareholding Snapshot : Mar 2026
Shareholding Compare (%holding)
Promoters
None
Held by 2 Schemes (0.02%)
Held by 0 FIIs
U Shin Limited (26.0%)
Consortium Vyapaar Limited (13.61%)
6.72%
Quarterly Results Snapshot (Standalone) - Mar'26 - QoQ

QoQ Growth in quarter ended Mar 2026 is 9.16% vs 1.17% in Dec 2025
QoQ Growth in quarter ended Mar 2026 is 25.58% vs 23.21% in Dec 2025
Half Yearly Results Snapshot (Standalone) - Sep'25

Growth in half year ended Sep 2025 is 11.92% vs 12.20% in Sep 2024
Growth in half year ended Sep 2025 is 34.72% vs -14.18% in Sep 2024
Nine Monthly Results Snapshot (Standalone) - Dec'25
YoY Growth in nine months ended Dec 2025 is 12.01% vs 15.89% in Dec 2024
YoY Growth in nine months ended Dec 2025 is 32.73% vs -13.94% in Dec 2024
Annual Results Snapshot (Standalone) - Mar'26
YoY Growth in year ended Mar 2026 is 13.32% vs 17.76% in Mar 2025
YoY Growth in year ended Mar 2026 is 44.94% vs -14.21% in Mar 2025
About Jay Ushin Ltd

Company Coordinates


