Talbros Engg.

  • Market Cap: Micro Cap
  • Industry: Auto Components & Equipments
  • ISIN: INE717E01013
  • NSEID:
  • BSEID: 538987
INR
710.55
33.2 (4.9%)
BSENSE

Feb 09

BSE+NSE Vol: 13.26 k

  • Price Points
  • Score
  • Mojo Parameters
  • Total Return
  • News and Corporate Actions
  • Key factors
  • Shareholding
  • Financials
  • CompanyCV
stock-summaryPrice Point
High/Low

1Day

52 Week

Valuation
Technical
Day's Volume

CASH

13.26 k (134.38%) Volume

Shareholding (Dec 2025)

FII

0.00%

Held by 0 FIIs

DII

0.00%

Held by 1 DIIs

Promoter

72.59%

Who are the top shareholders of the Talbros Engg.?

06-Jun-2025

The top shareholders of Talbros Engineering include Gita Talwar, the largest promoter with 19.93%, and Sartaj Kumar Sahni, the highest public shareholder at 8.88%. Individual investors hold 14.75% of the shares, with no pledged promoter holdings and minimal mutual fund or foreign institutional investor involvement.

The top shareholders of Talbros Engineering include the promoters, who hold the majority of the shares. Gita Talwar is the promoter with the highest holding, owning 19.93% of the company. The highest public shareholder is Sartaj Kumar Sahni, who holds 8.88%. Additionally, individual investors collectively hold 14.75% of the shares. There are no pledged promoter holdings, and the company has minimal mutual fund and foreign institutional investor involvement.

View full answer

Who are in the management team of Talbros Engg.?

06-Jun-2025

As of March 2022, the management team of Talbros Engineering includes Sunil Kumar, Vijay Kumar Sharma, Kuldeep Singh Bhalla, Ankush Jindal, Sanjay Sharma, Sarabjeet Singh, and Shashi Khurana, featuring a mix of executive and independent directors along with a company secretary.

As of March 2022, the management team of Talbros Engineering includes the following individuals:<BR><BR>1. Sunil Kumar - Independent Director<BR>2. Vijay Kumar Sharma - Executive Director<BR>3. Kuldeep Singh Bhalla - Independent Director<BR>4. Ankush Jindal - Company Secretary<BR>5. Sanjay Sharma - Executive Director<BR>6. Sarabjeet Singh - Independent Director<BR>7. Shashi Khurana - Independent Director<BR>8. Shashi Khurana - Additional Independent Director<BR><BR>This team comprises a mix of executive and independent directors, along with a company secretary.

View full answer

What is the bonus history of the Talbros Engg.?

06-Jun-2025

Talbros Engineering Ltd has a bonus history that includes a 1:1 bonus issue announced on October 12, 2017, allowing shareholders to double their holdings.

Talbros Engineering Ltd has a bonus history that includes a notable 1:1 bonus issue. This was announced with an ex-date of October 12, 2017, and the record date was October 14, 2017. This means that for every share held, shareholders received an additional share, effectively doubling their holdings at that time. If you need more details about the company's performance or other corporate actions, feel free to ask!

View full answer

Has Talbros Engg. declared dividend?

06-Jun-2025

Yes, Talbros Engineering Ltd has declared a 25% dividend, amounting to ₹2.5 per share, with an ex-date of September 23, 2024. While recent returns have shown volatility, the company has demonstrated significant growth over the longer term, particularly with a total return of 582.47% over the past five years.

Talbros Engineering Ltd has declared a 25% dividend.<BR><BR>Dividend Details:<BR>- Percentage announced: 25%<BR>- Amount per share: 2.5<BR>- Ex-date: 23 Sep 24<BR><BR>Dividend Yield: 0.41%.<BR><BR>Total Returns by Period:<BR>In the last 6 months, the price return was -7.62%, with a dividend return of 0%, resulting in a total return of -7.62%.<BR><BR>Over the past year, the price return was 6.6%, the dividend return was 0.44%, leading to a total return of 7.04%.<BR><BR>In the 2-year period, the price return was 13.52%, with a dividend return of 1.12%, culminating in a total return of 14.64%.<BR><BR>For the 3-year period, the price return was 74.13%, while the dividend return was 2.58%, giving a total return of 76.71%.<BR><BR>In the last 4 years, the price return reached 269.99%, with a dividend return of 3.50%, resulting in a total return of 273.49%.<BR><BR>Over the 5-year period, the price return was 572.08%, and the dividend return was 10.39%, leading to an impressive total return of 582.47%.<BR><BR>Overall, Talbros Engineering Ltd has declared a dividend, and while recent returns have shown some volatility, the longer-term performance reflects substantial growth, particularly in price returns over the past five years.

View full answer

Who are the peers of the Talbros Engg.?

03-Jun-2025

Talbros Engg.'s peers include Samvardh. Mothe., Bosch, Schaeffler India, Bharat Forge, and others. Management risk varies from excellent at Bosch and Schaeffler to below average at Pritika Auto, with Talbros showing good management risk and average growth, while its 1-year return is 3.94%.

Peers: The peers of Talbros Engg. are Samvardh. Mothe., Bosch, Schaeffler India, Bharat Forge, Tube Investments, Pritika Auto, LGB Forge, Setco Automotive, Jay Ushin, and Bimetal Bearings.<BR><BR>Quality Snapshot: Excellent management risk is observed at Schaeffler India, Tube Investments, and Bosch, while Good management risk is found at Talbros Engg., Bharat Forge, Setco Automotive, and the rest. Average management risk is seen at Samvardh. Mothe. and Jay Ushin, while Below Average management risk is present at Pritika Auto, LGB Forge, and the rest. For Growth, Excellent growth is noted at Schaeffler India and Tube Investments, while Average growth is found at Talbros Engg., Samvardh. Mothe., Bharat Forge, and the rest. Below Average growth is observed at Pritika Auto, LGB Forge, Jay Ushin, and the rest. In terms of Capital Structure, Excellent capital structure is seen at Bosch and Schaeffler India, while Average capital structure is present at Talbros Engg. and Bharat Forge, and Below Average capital structure is noted at Pritika Auto, LGB Forge, Setco Automotive, and the rest.<BR><BR>Return Snapshot: The peer with the highest 1-year return is Setco Automotive at 75.21%, while the lowest is Bharat Forge at -20.70%. Talbros Engg.'s own 1-year return is 3.94%, which is higher than Bharat Forge's but lower than Setco Automotive's. Additionally, peers such as Tube Investments, Pritika Auto, and Bharat Forge have negative six-month returns.

View full answer

What is the technical trend for Talbros Engg.?

09-Jun-2025

As of May 16, 2025, Talbros Engg. shows a mildly bearish trend based on daily moving averages, despite mixed signals from weekly and monthly indicators.

As of 16 May 2025, the technical trend for Talbros Engg. has changed from sideways to mildly bearish. The daily moving averages indicate a mildly bearish stance, while the weekly MACD shows a mildly bullish signal, contrasting with the monthly MACD which is mildly bearish. The KST on a monthly basis is bearish, while it is mildly bullish weekly. The Bollinger Bands are bullish weekly but sideways monthly, suggesting mixed signals. Overall, the current technical stance is mildly bearish, driven primarily by the daily moving averages and the monthly MACD.

View full answer

What does Talbros Engg. do?

17-Jul-2025

Talbros Engineering Ltd is a micro-cap manufacturer of axle shafts for OEMs in the auto components industry, reporting net sales of ₹1,252 Cr and a net profit of ₹53 Cr for Q1 2025. The company has a market cap of ₹295 Cr and key metrics include a P/E ratio of 15.00 and a dividend yield of 0.43%.

Overview:<BR>Talbros Engineering Ltd is a leading manufacturer of axle shafts for OEMs in the auto components and equipment industry, categorized as a micro-cap company.<BR><BR>History:<BR>Incorporated in October 1986, Talbros Engineering Ltd has established itself in the market and reported its latest quarterly results for March 2025, showcasing its sales and profit performance.<BR><BR>Financial Snapshot:<BR>Net Sales: 1,252 Cr (Quarterly Results - Mar 2025) <BR>Net Profit: 53 Cr (Quarterly Results - Mar 2025) <BR>Market Cap: INR 295 Cr (Micro Cap)<BR><BR>Key Metrics:<BR>P/E: 15.00 <BR>Industry P/E: 39 <BR>Dividend Yield: 0.43% <BR>Debt-Equity: 0.85 <BR>Return on Equity: 13.06% <BR>Price to Book: 1.91 <BR><BR>Contact Details:<BR>Address: Plot No 74-75, Sector 6 Faridabad Haryana : 121006 <BR>Tel: 91-129-4284300 <BR>Email: cs@bnt-talbros.com <BR>Website: http://www.talbrosaxles.com

View full answer

How big is Talbros Engg.?

24-Jul-2025

As of 24th July, Talbros Engineering Ltd has a market capitalization of 297.00 Cr, with recent net sales of 446.09 Cr and a net profit of 20.17 Cr. Shareholder's funds were 135.56 Cr and total assets amounted to 289.01 Cr as of March 2024.

As of 24th July, Talbros Engineering Ltd has a market capitalization of 297.00 Cr, categorizing it as a Micro Cap company.<BR><BR>For the latest four quarters, the company reported Net Sales of 446.09 Cr and a Net Profit of 20.17 Cr.<BR><BR>As of the latest annual period in March 2024, the Shareholder's Funds were 135.56 Cr and Total Assets amounted to 289.01 Cr.

View full answer

Is Talbros Engg. overvalued or undervalued?

03-Oct-2025

As of October 1, 2025, Talbros Engineering is considered very attractive and undervalued, with a PE ratio of 14.86 and strong long-term performance, significantly outperforming peers like Bosch and Samvardhana Motherson International.

As of 1 October 2025, the valuation grade for Talbros Engineering has moved from attractive to very attractive, indicating a significant improvement in its perceived value. The company is currently considered undervalued. Key ratios supporting this assessment include a PE ratio of 14.86, an EV to EBITDA of 8.59, and a PEG ratio of 0.88, all of which suggest that the stock is trading at a discount compared to its earnings growth potential.<BR><BR>In comparison to its peers, Talbros stands out favorably. For instance, Bosch is deemed expensive with a PE ratio of 50.88, while Samvardhana Motherson International, classified as attractive, has a PE of 32.77. These comparisons highlight Talbros' competitive positioning within the auto components industry. Despite a recent decline in stock price, Talbros has shown strong long-term performance, with a remarkable 628.40% return over the past five years, significantly outpacing the Sensex's 109.28% return in the same period.

View full answer

When is the next results date for Talbros Engg.?

29-Oct-2025

Talbros Engg. will announce its results on 06 November 2025.

Talbros Engg. is scheduled to declare its results on 06 November 2025.

View full answer

How has been the historical performance of Talbros Engg.?

01-Dec-2025

Talbros Engg. has shown mixed historical performance, with net sales increasing from INR 410.03 crore in Mar'24 to INR 446.09 crore in Mar'25, alongside rising costs and fluctuating profit margins. While profits improved, total assets and liabilities also grew, indicating a complex financial landscape.

Answer:<BR>The historical performance of Talbros Engg. shows a mixed trend in various financial metrics over the years.<BR><BR>Breakdown:<BR>Talbros Engg. has experienced fluctuations in net sales, with a notable increase from INR 410.03 crore in Mar'24 to INR 446.09 crore in Mar'25, following a slight dip from INR 444.17 crore in Mar'23. The total operating income mirrored this trend, rising to INR 446.09 crore in Mar'25 from INR 410.03 crore in Mar'24. The raw material costs also increased, reaching INR 239.28 crore in Mar'25, while total expenditure rose to INR 396.30 crore. Operating profit (PBDIT) was INR 50.22 crore in Mar'25, up from INR 43.67 crore in Mar'24, although it was lower than the INR 56.02 crore recorded in Mar'23. Profit before tax improved to INR 27.20 crore in Mar'25 from INR 24.11 crore in Mar'24, while profit after tax increased to INR 20.17 crore from INR 17.83 crore in the same period. The company's total assets grew to INR 336.85 crore in Mar'25, up from INR 289.01 crore in Mar'24, and total liabilities also increased to INR 336.85 crore from INR 289.01 crore. Cash flow from operating activities showed a positive trend, reaching INR 34 crore in Mar'25, compared to INR 31 crore in Mar'24. Overall, while Talbros Engg. has seen growth in sales and profits, it has also faced rising costs and fluctuating profit margins.

View full answer

Are Talbros Engineering Ltd latest results good or bad?

07-Feb-2026

Talbros Engineering Ltd's latest Q3 FY26 results are positive, with a net profit of ₹7.49 crore, reflecting a 14.53% quarter-on-quarter and 40.26% year-on-year increase, alongside stable operating margins and improved profit after tax margins. The strong performance indicates effective cost management and robust demand in the automotive sector, boosting investor confidence.

Talbros Engineering Ltd's latest results for Q3 FY26 can be considered quite good. The company reported a net profit of ₹7.49 crore, which reflects a 14.53% increase quarter-on-quarter and a significant 40.26% increase year-on-year. Revenue also showed positive growth, reaching ₹138.97 crore, up 6.33% from the previous quarter and 21.16% from the same quarter last year. <BR><BR>The operating margin remained stable at 11.08%, and the profit after tax (PAT) margin improved to 5.39%, marking the highest level in seven quarters. This indicates effective cost management and operational efficiency, especially given the challenges posed by rising raw material costs.<BR><BR>Overall, the results demonstrate strong operational momentum and a positive outlook for the company, supported by robust demand across various automotive segments. The stock has reacted positively, trading near its 52-week high, which further underscores investor confidence in the company's performance and future prospects.

View full answer

Should I buy, sell or hold Talbros Engineering Ltd?

07-Feb-2026

Why is Talbros Engineering Ltd falling/rising?

08-Feb-2026

As of 08-Feb, Talbros Engineering Ltd's stock price is at Rs. 690.00, having risen 1.78% today and reaching a 52-week high of Rs. 701.2. The stock has outperformed the Sensex significantly, showing strong momentum and increased investor interest.

As of 08-Feb, Talbros Engineering Ltd's stock price is rising, currently at Rs. 690.00, reflecting an increase of Rs. 12.1 or 1.78%. The stock has shown strong performance recently, with a notable rise of 15.1% over the last four days, indicating a positive momentum. Today, it reached a new 52-week high of Rs. 701.2, which is a significant milestone for the company.<BR><BR>In terms of comparative performance, Talbros Engineering Ltd has outperformed the Sensex by 3.47% today, and over the past week, the stock has increased by 8.29%, while the Sensex only rose by 1.59%. Additionally, the stock has demonstrated resilience over the past month with a gain of 10.22%, contrasting with a decline of 1.74% in the Sensex during the same period.<BR><BR>The stock is also trading above its moving averages across various time frames, including the 5-day, 20-day, 50-day, 100-day, and 200-day averages, which typically indicates a bullish trend. Furthermore, there has been a significant increase in investor participation, with delivery volume rising by 610.76% compared to the 5-day average, suggesting heightened interest and confidence among investors.<BR><BR>Overall, the combination of strong recent performance, positive investor sentiment, and favorable technical indicators contributes to the rising stock price of Talbros Engineering Ltd.

View full answer
iScoreScore
Click here to find our call on this stock
Strong Sell
Sell
Hold
Buy
Strong Buy

MarketsMojo — Loved in India, Now Global

The power of Mojo is now in 29 countries. Explore global equities with the same cutting-edge features you love.

Dashboard

1

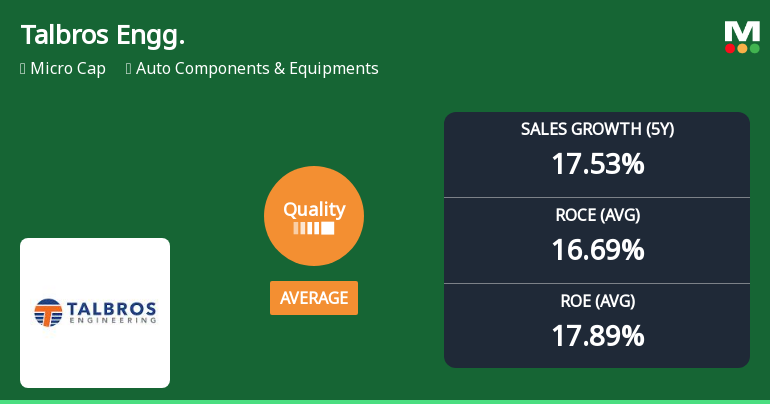
High Management Efficiency with a high ROCE of 17.24%

 
2

Positive results in Dec 25

3

With ROCE of 14.3, it has a Attractive valuation with a 1.7 Enterprise value to Capital Employed

4

Majority shareholders : Promoters

 
stock-summaryMojo Parameters

Mojo Parameters

Loading Valuation Snapshot...

Stock DNA

stock-summary
Industry

Auto Components & Equipments

stock-summary
Market cap

INR 370 Cr (Micro Cap)

stock-summary
P/E

14.00

stock-summary
Industry P/E

37

stock-summary
Dividend Yield

0.36%

stock-summary
Debt Equity

0.78

stock-summary
Return on Equity

13.78%

stock-summary
Price to Book

2.12

Revenue and Profits:
Net Sales:
139 Cr
(Quarterly Results - Dec 2025)
Net Profit:
7 Cr
stock-summaryTotal Returns
Total Returns (Price + Dividend) stock-summary
Dividend Yield (0.36%)
TimePeriod
Price Return
Dividend Return
Total Return
3 Months
8.14%
0%
8.14%
6 Months
23.93%
0.44%
24.37%
1 Year
18.62%
0.45%
19.07%
2 Years
6.6%
0.79%
7.39%
3 Years
32.28%
1.75%
34.03%
4 Years
83.34%
3.09%
86.43%
5 Years
334.99%
6.20%
341.19%

Latest dividend: 2.5 per share ex-dividend date: Sep-23-2025

Risk Adjusted Returns v/s stock-summary
Returns Beta
Icon
Beta has not been calculated since enough price history is not available
stock-summaryNews & Corporate Actions

News

Announcements stock-summary

Announcement under Regulation 30 (LODR)-Newspaper Publication

07-Feb-2026 | Source : BSE

Newspaper publishment of Unaudited Financial Results of the company for the quarter and nine months ended December 31 2025.

Financial Results For The Quarter Ended December 31 2025

06-Feb-2026 | Source : BSE

Financial Results for the quarter ended December 31 2025

Announcement under Regulation 30 (LODR)-Change in Management

06-Feb-2026 | Source : BSE

Board of Directors in their meeting held on February 06 2026 have considered and approved appointment of M/s Bansal Harshit and Associates as the Internal Auditor of the company for the period January 1 2026 to March 31 2026 and also took note of resignation of M/s G R A B & Associates as Internal Auditor of the company.

Corporate Actions stock-summary

stock-summary
BOARD MEETING

No Upcoming Board Meetings

stock-summary
DIVIDEND

Talbros Engineering Ltd has declared 25% dividend, ex-date: 23 Sep 25

stock-summary
SPLITS

No Splits history available

stock-summary
BONUS

Talbros Engineering Ltd has announced 1:1 bonus issue, ex-date: 12 Oct 17

stock-summary
RIGHTS

No Rights history available

stock-summaryKey Factors

Quality key factors stock-summary

Factor
Value
Sales Growth (5y)
22.54%
EBIT Growth (5y)
30.93%
EBIT to Interest (avg)
3.97
Debt to EBITDA (avg)
2.27
Net Debt to Equity (avg)
0.78
Sales to Capital Employed (avg)
1.80
Tax Ratio
26.42%
Dividend Payout Ratio
11.39%
Pledged Shares
0
Institutional Holding
0.02%
ROCE (avg)
16.61%
ROE (avg)
18.33%

Valuation key factors

Factor
Value
P/E Ratio
14
Industry P/E
37
Price to Book Value
2.18
EV to EBIT
10.93
EV to EBITDA
8.63
EV to Capital Employed
1.66
EV to Sales
0.95
PEG Ratio
0.49
Dividend Yield
0.35%
ROCE (Latest)
14.34%
ROE (Latest)
15.08%

Technicals key factors

Indicator
Weekly
Monthly
MACD
Bullish
Bullish
RSI
No Signal
No Signal
Bollinger Bands
Bullish
Bullish
Moving Averages
Bullish (Daily)
KST
Mildly Bearish
Bullish
Dow Theory
Mildly Bullish
Mildly Bullish
stock-summary Technical Indicator Scale: Bearish, Mildly Bearish, Sideways, Mildly Bullish, Bullish  Turned 
stock-summaryShareholding
Shareholding Snapshot : Dec 2025stock-summary
Shareholding Compare (%holding) stock-summary
Majority shareholders

Promoters

Pledged Promoter Holdings

None

Mutual Funds

Held by 1 Schemes (0.01%)

FIIs

Held by 0 FIIs

Promoter with highest holding

Gita Talwar (19.93%)

Highest Public shareholder

Sartaj Kumar Sahni (8.88%)

Individual Investors Holdings

14.8%

stock-summaryFinancial
[
  {
    "link": "quarterly",
    "btn_text": "All Quarterly Results",
    "header": "Quarterly Results Snapshot (Standalone) - Dec'25 - QoQ",
    "rhs": [
      {
        "prefix": "Net Sales ",
        "suffix": "QoQ Growth in quarter ended Dec 2025 is 6.33% vs 7.03% in Sep 2025",
        "dir": -1
      },
      {
        "prefix": "Standalone Net Profit ",
        "suffix": "QoQ Growth in quarter ended Dec 2025 is 14.53% vs 17.20% in Sep 2025",
        "dir": -1
      }
    ],
    "table": {
      "header": [
        "Dec'25",
        "Sep'25",
        "Change(%)"
      ],
      "body": [
        {
          "field": "Net Sales",
          "val1": "138.97",
          "val2": "130.70",
          "chgp": "6.33%",
          "chgp_class": "positive"
        },
        {
          "field": "Operating Profit (PBDIT) excl Other Income",
          "val1": "15.40",
          "val2": "14.51",
          "chgp": "6.13%",
          "chgp_class": "positive"
        },
        {
          "field": "Interest",
          "val1": "2.88",
          "val2": "3.70",
          "chgp": "-22.16%",
          "chgp_class": "positive"
        },
        {
          "field": "Exceptional Items",
          "val1": "0.00",
          "val2": "0.00",
          "chgp": "",
          "chgp_class": "neutral"
        },
        {
          "field": "Standalone Net Profit",
          "val1": "7.49",
          "val2": "6.54",
          "chgp": "14.53%",
          "chgp_class": "positive"
        },
        {
          "field": "Operating Profit Margin (Excl OI)",
          "val1": "11.08%",
          "val2": "11.10%",
          "chgp": "-0.02%",
          "chgp_class": "negative"
        }
      ]
    }
  },
  {
    "link": "half-yearly",
    "btn_text": "All Half Yearly Results",
    "header": "Half Yearly Results Snapshot (Standalone) - Sep'25",
    "rhs": [
      {
        "prefix": "Net Sales ",
        "suffix": " Growth in half year ended Sep 2025 is 22.59% vs 3.66% in Sep 2024",
        "dir": 1
      },
      {
        "prefix": "Standalone Net Profit ",
        "suffix": " Growth in half year ended Sep 2025 is 27.55% vs 5.78% in Sep 2024",
        "dir": 1
      }
    ],
    "table": {
      "header": [
        "Sep'25",
        "Sep'24",
        "Change(%)"
      ],
      "body": [
        {
          "field": "Net Sales",
          "val1": "252.82",
          "val2": "206.23",
          "chgp": "22.59%",
          "chgp_class": "positive"
        },
        {
          "field": "Operating Profit (PBDIT) excl Other Income",
          "val1": "27.35",
          "val2": "23.15",
          "chgp": "18.14%",
          "chgp_class": "positive"
        },
        {
          "field": "Interest",
          "val1": "6.64",
          "val2": "5.17",
          "chgp": "28.43%",
          "chgp_class": "negative"
        },
        {
          "field": "Exceptional Items",
          "val1": "0.00",
          "val2": "0.00",
          "chgp": "",
          "chgp_class": "neutral"
        },
        {
          "field": "Standalone Net Profit",
          "val1": "12.13",
          "val2": "9.51",
          "chgp": "27.55%",
          "chgp_class": "positive"
        },
        {
          "field": "Operating Profit Margin (Excl OI)",
          "val1": "10.82%",
          "val2": "11.23%",
          "chgp": "-0.41%",
          "chgp_class": "negative"
        }
      ]
    }
  },
  {
    "link": "nine-monthly",
    "btn_text": "All Nine Monthly Results",
    "header": "Nine Monthly Results Snapshot (Standalone) - Dec'25",
    "rhs": [
      {
        "prefix": "Net Sales ",
        "suffix": "YoY Growth in nine months ended Dec 2025 is 22.08% vs 4.48% in Dec 2024",
        "dir": 1
      },
      {
        "prefix": "Standalone Net Profit ",
        "suffix": "YoY Growth in nine months ended Dec 2025 is 32.12% vs 10.57% in Dec 2024",
        "dir": 1
      }
    ],
    "table": {
      "header": [
        "Dec'25",
        "Dec'24",
        "Change(%)"
      ],
      "body": [
        {
          "field": "Net Sales",
          "val1": "391.79",
          "val2": "320.93",
          "chgp": "22.08%",
          "chgp_class": "positive"
        },
        {
          "field": "Operating Profit (PBDIT) excl Other Income",
          "val1": "42.75",
          "val2": "35.83",
          "chgp": "19.31%",
          "chgp_class": "positive"
        },
        {
          "field": "Interest",
          "val1": "9.52",
          "val2": "8.34",
          "chgp": "14.15%",
          "chgp_class": "negative"
        },
        {
          "field": "Exceptional Items",
          "val1": "0.00",
          "val2": "0.00",
          "chgp": "",
          "chgp_class": "neutral"
        },
        {
          "field": "Standalone Net Profit",
          "val1": "19.62",
          "val2": "14.85",
          "chgp": "32.12%",
          "chgp_class": "positive"
        },
        {
          "field": "Operating Profit Margin (Excl OI)",
          "val1": "10.91%",
          "val2": "11.16%",
          "chgp": "-0.25%",
          "chgp_class": "negative"
        }
      ]
    }
  },
  {
    "link": "annual",
    "btn_text": "All Annual Results",
    "header": "Annual Results Snapshot (Standalone) - Mar'25",
    "rhs": [
      {
        "prefix": "Net Sales ",
        "suffix": "YoY Growth in year ended Mar 2025 is 8.79% vs -7.69% in Mar 2024",
        "dir": 1
      },
      {
        "prefix": "Standalone Net Profit ",
        "suffix": "YoY Growth in year ended Mar 2025 is 13.12% vs -36.16% in Mar 2024",
        "dir": 1
      }
    ],
    "table": {
      "header": [
        "Mar'25",
        "Mar'24",
        "Change(%)"
      ],
      "body": [
        {
          "field": "Net Sales",
          "val1": "446.09",
          "val2": "410.03",
          "chgp": "8.79%",
          "chgp_class": "positive"
        },
        {
          "field": "Operating Profit (PBDIT) excl Other Income",
          "val1": "49.79",
          "val2": "43.05",
          "chgp": "15.66%",
          "chgp_class": "positive"
        },
        {
          "field": "Interest",
          "val1": "11.76",
          "val2": "9.58",
          "chgp": "22.76%",
          "chgp_class": "negative"
        },
        {
          "field": "Exceptional Items",
          "val1": "0.00",
          "val2": "0.00",
          "chgp": "",
          "chgp_class": "neutral"
        },
        {
          "field": "Standalone Net Profit",
          "val1": "20.17",
          "val2": "17.83",
          "chgp": "13.12%",
          "chgp_class": "positive"
        },
        {
          "field": "Operating Profit Margin (Excl OI)",
          "val1": "11.16%",
          "val2": "10.50%",
          "chgp": "0.66%",
          "chgp_class": "positive"
        }
      ]
    }
  }
]

Quarterly Results Snapshot (Standalone) - Dec'25 - QoQstock-summary

Dec'25
Sep'25
Change(%)
Net Sales
138.97
130.70
6.33%
Operating Profit (PBDIT) excl Other Income
15.40
14.51
6.13%
Interest
2.88
3.70
-22.16%
Exceptional Items
0.00
0.00
Standalone Net Profit
7.49
6.54
14.53%
Operating Profit Margin (Excl OI)
11.08%
11.10%
-0.02%
Values in Rs Cr.
Direction Arrows
Net Sales

QoQ Growth in quarter ended Dec 2025 is 6.33% vs 7.03% in Sep 2025

Direction Arrows
Standalone Net Profit

QoQ Growth in quarter ended Dec 2025 is 14.53% vs 17.20% in Sep 2025

Half Yearly Results Snapshot (Standalone) - Sep'25stock-summary

Sep'25
Sep'24
Change(%)
Net Sales
252.82
206.23
22.59%
Operating Profit (PBDIT) excl Other Income
27.35
23.15
18.14%
Interest
6.64
5.17
28.43%
Exceptional Items
0.00
0.00
Standalone Net Profit
12.13
9.51
27.55%
Operating Profit Margin (Excl OI)
10.82%
11.23%
-0.41%
Values in Rs Cr.
Direction Arrows
Net Sales

Growth in half year ended Sep 2025 is 22.59% vs 3.66% in Sep 2024

Direction Arrows
Standalone Net Profit

Growth in half year ended Sep 2025 is 27.55% vs 5.78% in Sep 2024

Nine Monthly Results Snapshot (Standalone) - Dec'25stock-summary

Dec'25
Dec'24
Change(%)
Net Sales
391.79
320.93
22.08%
Operating Profit (PBDIT) excl Other Income
42.75
35.83
19.31%
Interest
9.52
8.34
14.15%
Exceptional Items
0.00
0.00
Standalone Net Profit
19.62
14.85
32.12%
Operating Profit Margin (Excl OI)
10.91%
11.16%
-0.25%
Values in Rs Cr.
Direction Arrows
Net Sales

YoY Growth in nine months ended Dec 2025 is 22.08% vs 4.48% in Dec 2024

Direction Arrows
Standalone Net Profit

YoY Growth in nine months ended Dec 2025 is 32.12% vs 10.57% in Dec 2024

Annual Results Snapshot (Standalone) - Mar'25stock-summary

Mar'25
Mar'24
Change(%)
Net Sales
446.09
410.03
8.79%
Operating Profit (PBDIT) excl Other Income
49.79
43.05
15.66%
Interest
11.76
9.58
22.76%
Exceptional Items
0.00
0.00
Standalone Net Profit
20.17
17.83
13.12%
Operating Profit Margin (Excl OI)
11.16%
10.50%
0.66%
Values in Rs Cr.
Direction Arrows
Net Sales

YoY Growth in year ended Mar 2025 is 8.79% vs -7.69% in Mar 2024

Direction Arrows
Standalone Net Profit

YoY Growth in year ended Mar 2025 is 13.12% vs -36.16% in Mar 2024

stock-summaryCompany CV
About Talbros Engineering Ltd stock-summary
stock-summary
Talbros Engineering Ltd
Micro Cap
Auto Components & Equipments
Talbros Engineering Limited, incorporated in October, 1986 is having a manufacturing plant in Faridabad. The Company is the leading manufacturer of Axle Shafts for OEM's in India, servicing Passenger Vehicle, Commercial Vehicle, Off-road and Tractor segments with their Light, Medium and Heavy Duty product range, having an installed annual capacity of 3 Million Axle Shafts.
Company Coordinates stock-summary
Company Details
Plot No 74-75, Sector 6 Faridabad Haryana : 121006
stock-summary
Tel: 91-129-4284300
stock-summary
cs@bnt-talbros.com
Registrar Details
Beetal Financial & Computer Services (P) Ltd , Beetal House , 99 Mandangir, 3rd Floor, Behind Local Shopping Centre, Near Dada Harsukhdas Mandir, New Delhi