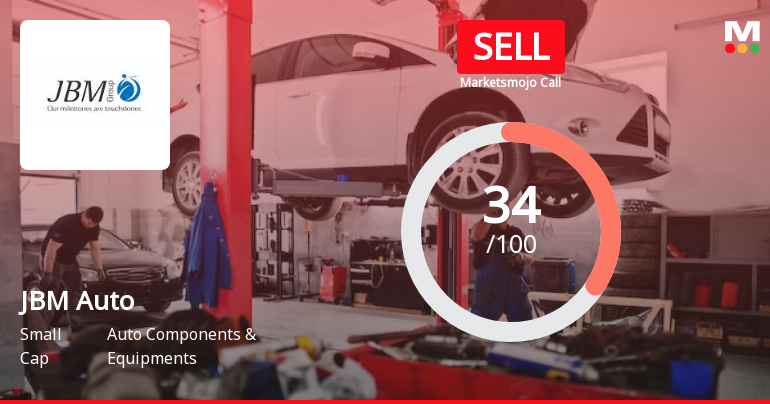
JBM Auto

  • Market Cap: Small Cap
  • Industry: Auto Components & Equipments
  • ISIN: INE927D01051
  • NSEID: JBMA
  • BSEID: 532605
INR
648.65
-8.9 (-1.35%)
BSENSE

Aug 07, 03:30 PM

BSE+NSE Vol: 1.88 lacs

  • Price Points
  • Score
  • Mojo Parameters
  • Total Return
  • News and Corporate Actions
  • Key factors
  • Shareholding
  • Financials
  • CompanyCV
stock-summaryPrice Point
High/Low

1Day

52 Week

Valuation
Technical
Day's Volume

CASH

1.88 lacs (-3.84%) Volume

Shareholding (Jun 2026)

FII

2.03%

Held by 88 FIIs

DII

0.16%

Held by 2 DIIs

Promoter

67.53%

Why is JBM Auto Ltd falling/rising?

08-Aug-2026

As of 07-Aug, JBM Auto Ltd's stock price is at 648.55, reflecting a decline of 1.42% and underperforming the sector. The stock has shown negative returns over the past week and month, with decreased investor participation and significant financial challenges impacting its performance.

As of 07-Aug, JBM Auto Ltd's stock price is falling, currently at 648.55, which reflects a decrease of 9.35 or 1.42%. This decline is part of a broader trend, as the stock has underperformed the sector by 3.84% today and has experienced consecutive losses over the last two days, totaling a drop of 1.91%. <BR><BR>In terms of performance relative to the benchmark, the stock has shown negative returns over the past week and month, with declines of 1.57% and 3.66%, respectively, while the Sensex has posted modest gains. Additionally, the stock's moving averages indicate that it is currently lower than the 5-day, 20-day, and 50-day averages, suggesting a bearish trend in the short term.<BR><BR>Investor participation has also decreased, with delivery volume falling by 26.64% compared to the 5-day average, indicating reduced interest from investors. Furthermore, the company faces significant challenges, including a high Debt to EBITDA ratio of 4.30 times, which suggests a low ability to service its debt. Recent financial results have also been disappointing, with a 37% decline in profit before tax and a 25.4% drop in profit after tax compared to previous quarters.<BR><BR>While the company has shown healthy long-term growth in net sales and operating profit, the current financial metrics and investor sentiment are contributing to the stock's decline.

View full answer

Are JBM Auto Ltd latest results good or bad?

31-Jul-2026

JBM Auto Ltd's latest results show a year-on-year profit increase of 14.67% and a 15.04% rise in net sales, indicating some resilience; however, significant quarter-on-quarter declines in both profit and sales, along with high debt levels, suggest underlying financial challenges that warrant caution from investors.

JBM Auto Ltd's latest results present a mixed picture. On one hand, the company reported a consolidated net profit of ₹42.20 crore, which is a 14.67% increase year-on-year. This indicates some resilience in profitability compared to the same quarter last year. Additionally, net sales for Q1 FY27 rose by 15.04% year-on-year to ₹1,442.45 crore, suggesting strong revenue growth in a year-over-year context.<BR><BR>However, the quarter-on-quarter performance is concerning. Both net profit and net sales saw significant declines of 43.16% and 22.13%, respectively, compared to the previous quarter. This sharp drop raises questions about the sustainability of the company's earnings, especially as operating margins have also contracted from 12.76% in Q4 FY26 to 11.33% in Q1 FY27.<BR><BR>Moreover, the company's high debt levels and deteriorating interest coverage ratio, which fell to 1.97 times, indicate financial strain that could limit its operational flexibility. The reliance on non-operating income, which constituted over half of the profit before tax, further complicates the outlook.<BR><BR>Overall, while there are positive year-on-year growth metrics, the significant quarter-on-quarter declines and underlying financial challenges suggest that the results are not entirely favorable. Investors may want to approach with caution, given the mixed signals regarding profitability and operational stability.

View full answer

Should I buy, sell or hold JBM Auto Ltd?

31-Jul-2026

How big is JBM Auto?

11-Jun-2026

As of 10th June, JBM Auto Ltd has a market capitalization of 16,200.00 Cr, with recent net sales of 6088.37 Cr and a net profit of 218.78 Cr. Shareholder's funds are 1,350.64 Cr, and total assets amount to 5,849.70 Cr.

As of 10th June, JBM Auto Ltd has a market capitalization of 16,200.00 Cr, categorizing it as a Small Cap company.<BR><BR>In the latest four quarters, JBM Auto reported Net Sales of 6088.37 Cr and a Net Profit of 218.78 Cr.<BR><BR>The latest annual period for the balance sheet is March 2025, with Shareholder's Funds amounting to 1,350.64 Cr and Total Assets at 5,849.70 Cr.

View full answer

Who are in the management team of JBM Auto?

11-Jun-2026

The management team of JBM Auto includes S K Arya (Non Executive Chairman), Nishant Arya (Vice Chairman & Managing Director), and several Independent Directors: M K Aggarwal, Pravin Tripathi, Praveen Kumar Tripathi, and Valipe Ramgopal Rao, along with Dhiraj Mohan (Whole-time Director).

The management team of JBM Auto includes the following individuals:<BR><BR>1. S K Arya - Non Executive Chairman<BR>2. M K Aggarwal - Independent Director<BR>3. Pravin Tripathi - Independent Director<BR>4. Praveen Kumar Tripathi - Independent Director<BR>5. Valipe Ramgopal Rao - Independent Director<BR>6. Nishant Arya - Vice Chairman & Managing Director<BR>7. Dhiraj Mohan - Whole-time Director<BR><BR>If you need more details about their roles or contributions, feel free to ask!

View full answer

Who are the peers of the JBM Auto?

11-Jun-2026

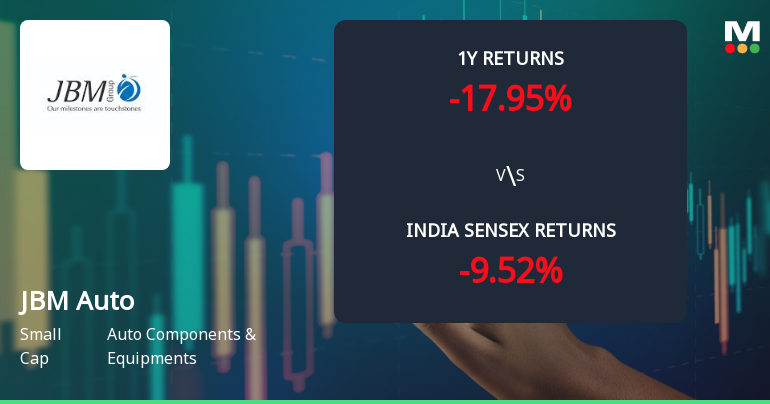
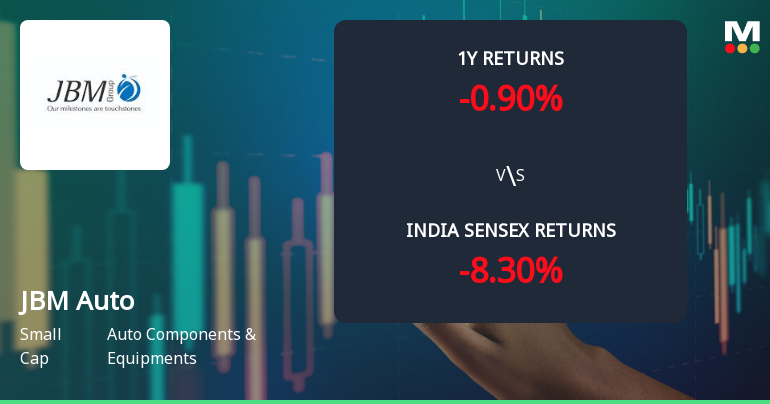
JBM Auto's peers include HBL Engineering, Belrise Industri, Sansera Engineering, Sundram Fasteners, CIE Automotive, Minda Corp, Shriram Pistons, Amara Raja Energy, and Gabriel India. JBM Auto has average management risk, excellent growth, and below average capital structure, with a 1-year return of -8.95%, better than Amara Raja Energy but lower than its other peers.

Peers: The peers of JBM Auto are HBL Engineering, Belrise Industri, Sansera Enginee., Sundram Fasten., CIE Automotive, Minda Corp, Shriram Pistons, Amara Raja Ener., and Gabriel India.<BR><BR>Quality Snapshot: Excellent management risk is observed at Shriram Pistons, while Good management risk is found at Sansera Enginee., Sundram Fasten., CIE Automotive, Minda Corp, Amara Raja Ener., and Gabriel India, and the rest have Average management risk, including JBM Auto and HBL Engineering. For growth, Excellent growth is noted at JBM Auto, HBL Engineering, Minda Corp, and Shriram Pistons, while Good growth is seen at CIE Automotive, and the rest have Average or Below Average growth, including Belrise Industri, Sansera Enginee., Sundram Fasten., and Amara Raja Ener. In terms of capital structure, Excellent capital structure is present at HBL Engineering, Sundram Fasten., CIE Automotive, and Shriram Pistons, while Good capital structure is found at Sansera Enginee., Minda Corp, and Gabriel India, and the rest, including JBM Auto, have Below Average or Average capital structure.<BR><BR>Return Snapshot: The peer with the highest 1-year return is Belrise Industri at 110.27%, while the lowest is Amara Raja Ener. at -20.82%. JBM Auto's 1-year return is -8.95%, which is higher than Amara Raja Ener. but lower than all other peers. Additionally, Sundram Fasten., Amara Raja Ener., and CIE Automotive have negative six-month returns.

View full answer

What does JBM Auto do?

10-Jun-2026

JBM Auto Ltd manufactures tools, dies, and moulds in the automotive sector and is part of the JBM Group, with a market cap of INR 16,200 Cr. As of March 2026, it reported net sales of 1,852 Cr and a net profit of 74 Cr.

Overview:<BR>JBM Auto Ltd is engaged in the manufacturing of tools, dies, and moulds within the Auto Components & Equipments industry and is categorized as a Small Cap company.<BR><BR>History:<BR>JBM Auto Ltd is the flagship company of JBM Group and has a diversified portfolio in automotive, engineering & design services, and renewables. The latest quarterly results reported net sales and profit for the period ending March 2026.<BR><BR>Financial Snapshot:<BR>- Net Sales: 1,852 Cr (Quarterly Results - Mar 2026)<BR>- Net Profit: 74 Cr (Quarterly Results - Mar 2026)<BR>- Market Cap: INR 16,200 Cr (Small Cap)<BR><BR>Key Metrics:<BR>- P/E: 70.00<BR>- Industry P/E: 36<BR>- Dividend Yield: 0.13%<BR>- Debt-Equity: 1.88<BR>- Return on Equity: 14.71%<BR>- Price to Book: 10.41<BR><BR>Contact Details:<BR>- Address: 601 Hemkunt Chambers, 89 Nehru Place New Delhi New Delhi : 110019<BR>- Phone: 91-11-26427104<BR>- Email: corp@jbm.co.in<BR>- Website: http://www.jbmgroup.com

View full answer

When is the next results date for JBM Auto Ltd?

29-Apr-2026

The next results date for JBM Auto Ltd is 11 May 2026.

The next results date for JBM Auto Ltd is scheduled for 11 May 2026.

View full answer

How has been the historical performance of JBM Auto?

01-Dec-2025

JBM Auto has shown significant growth from March 2019 to March 2025, with net sales increasing from 1,786.43 Cr to 5,472.33 Cr and operating profit rising from a loss of 154.54 Cr to a profit of 730.39 Cr. The company has consistently improved its profitability, total assets, and cash flow during this period.

Answer:<BR>The historical performance of JBM Auto shows a significant upward trend in net sales and profitability over the years, culminating in the fiscal year ending March 2025.<BR><BR>Breakdown:<BR>JBM Auto's net sales have increased from 1,786.43 Cr in March 2019 to 5,472.33 Cr in March 2025, reflecting a strong growth trajectory. Total operating income followed a similar pattern, reaching 5,472.33 Cr in March 2025, up from 1,786.43 Cr in March 2019. The company's operating profit (PBDIT) also saw substantial growth, rising from a loss of 154.54 Cr in March 2019 to a profit of 730.39 Cr in March 2025. Profit before tax increased from 137.30 Cr in March 2019 to 308.71 Cr in March 2025, while profit after tax rose from 85.14 Cr to 250.15 Cr in the same period. The company's total assets grew from 2,008.98 Cr in March 2019 to 5,849.70 Cr in March 2025, with total liabilities also increasing from 1,965.94 Cr to 5,849.70 Cr. Cash flow from operating activities improved significantly, reaching 393.00 Cr in March 2025, compared to 369.00 Cr in March 2020. Overall, JBM Auto has demonstrated a robust financial performance with consistent growth in sales, profits, and asset base over the years.

View full answer

Is JBM Auto technically bullish or bearish?

29-Nov-2025

As of November 28, 2025, the technical trend is mildly bearish due to bearish signals in the weekly and monthly MACD and Bollinger Bands, despite some short-term support from daily moving averages.

As of 28 November 2025, the technical trend has changed from sideways to mildly bearish. The current stance is mildly bearish, driven by bearish signals in the weekly and monthly MACD and Bollinger Bands. The weekly KST shows bullishness, but this is overshadowed by the overall bearish sentiment in the longer time frames. The daily moving averages are mildly bullish, providing some short-term support, but the Dow Theory indicates a mildly bearish outlook on the weekly chart. The stock has underperformed significantly compared to the Sensex over various periods, further reinforcing the bearish sentiment.

View full answer

Is JBM Auto overvalued or undervalued?

03-Nov-2025

As of October 31, 2025, JBM Auto is fairly valued with a PE ratio of 75.54, an EV to EBITDA of 43.44, and a Price to Book Value of 1.16, despite underperforming with a year-to-date return of -13.34% compared to the Sensex's 7.42% gain.

As of 31 October 2025, JBM Auto's valuation grade has moved from expensive to fair. The company appears to be fairly valued at this time. Key ratios include a PE ratio of 75.54, an EV to EBITDA of 43.44, and a Price to Book Value of 1.16. <BR><BR>In comparison to its peers, JBM Auto's PE ratio is significantly higher than Samvardhana Motherson's attractive rating at 32.55, while Bosch, which is also rated fair, has a PE of 49.53. Despite the high valuation metrics, JBM Auto's recent stock performance has been underwhelming, with a year-to-date return of -13.34%, contrasting with the Sensex's gain of 7.42%.

View full answer

Who are the top shareholders of the JBM Auto?

06-Jun-2025

The top shareholders of JBM Auto include Smc Credits Ltd with 16.35%, Zeal Impex And Traders Private Limited at 7.72%, individual investors with 12.11%, mutual funds holding 0.07%, and Foreign Institutional Investors (FIIs) at 2.75%.

The top shareholders of JBM Auto include the promoters, who hold the majority of the shares. The promoter with the highest holding is Smc Credits Ltd, which owns 16.35% of the company. Additionally, the highest public shareholder is Zeal Impex And Traders Private Limited, holding 7.72%. Individual investors collectively hold 12.11% of the shares, while mutual funds are represented by 13 schemes with a combined holding of 0.07%. Foreign Institutional Investors (FIIs) hold 2.75% of the shares through 81 different entities.

View full answer

What is the bonus history of the JBM Auto?

06-Jun-2025

JBM Auto has issued bonuses twice: a 1:1 bonus on October 8, 2014, with a record date of October 9, 2014, and a 1:2 bonus on October 24, 2007, with a record date of October 25, 2007. These events highlight the company's commitment to rewarding shareholders.

JBM Auto has a history of bonus issues that includes two significant events. The latest bonus was a 1:1 bonus issue, which was announced with an ex-date of October 8, 2014, and the record date was October 9, 2014. Prior to that, the company issued a 1:2 bonus on October 24, 2007, with the record date being October 25, 2007. This reflects JBM Auto's approach to rewarding its shareholders through bonus shares over the years.

View full answer

Has JBM Auto declared dividend?

06-Jun-2025

JBM Auto Ltd has declared a 75% dividend, amounting to ₹1.5 per share, with an ex-date of September 5, 2024. Despite recent short-term declines, the company has shown strong total returns over longer periods, particularly a total return of 731.31% over the last 4 years and 1875.97% over the last 5 years.

JBM Auto Ltd has declared a 75% dividend.<BR><BR>Dividend Details:<BR>- Percentage announced: 75%<BR>- Amount per share: 1.5<BR>- Ex-date: 05 Sep 24<BR><BR>Dividend Yield: 0.11%.<BR><BR>Total Returns by Period:<BR>In the last 6 months, JBM Auto experienced a price return of -12.06%, with no dividend return, resulting in a total return of -12.06%.<BR><BR>Over the past year, the company had a price return of -33.92% and a dividend return of 0.14%, leading to a total return of -33.78%.<BR><BR>In a 2-year period, JBM Auto saw a significant price return of 76.79% and a dividend return of 0.56%, culminating in a total return of 77.35%.<BR><BR>For the 3-year period, the price return was an impressive 209.54%, with a dividend return of 1.91%, resulting in a total return of 211.45%.<BR><BR>In the last 4 years, the company achieved a remarkable price return of 725.35% and a dividend return of 5.96%, leading to a total return of 731.31%.<BR><BR>Finally, over the past 5 years, JBM Auto recorded an extraordinary price return of 1859.54% and a dividend return of 16.43%, resulting in a total return of 1875.97%.<BR><BR>Overall, JBM Auto has declared a substantial dividend while also showing strong total returns over longer periods, particularly in the 4 and 5-year spans, indicating a positive performance trajectory despite recent short-term declines.

View full answer
iScoreScore
Click here to find our call on this stock
Strong Sell
Sell
Hold
Buy
Strong Buy

Dashboard

1

Low ability to service debt as the company has a high Debt to EBITDA ratio of 4.30 times

  • Low ability to service debt as the company has a high Debt to EBITDA ratio of 4.30 times
2

Negative results in Jun 26

3

With ROCE of 12, it has a Expensive valuation with a 4.1 Enterprise value to Capital Employed

4

Despite the size of the company, domestic mutual funds hold only 0.33% of the company

stock-summaryMojo Parameters

Mojo Parameters

Loading Valuation Snapshot...

Stock DNA

stock-summary
Industry

Auto Components & Equipments

stock-summary
Market cap

INR 15,484 Cr (Small Cap)

stock-summary
P/E

66.00

stock-summary
Industry P/E

38

stock-summary
Dividend Yield

0.13%

stock-summary
Debt Equity

1.88

stock-summary
Return on Equity

14.71%

stock-summary
Price to Book

10.12

Revenue and Profits:
Net Sales:
1,442 Cr
(Quarterly Results - Jun 2026)
Net Profit:
42 Cr
stock-summaryTotal Returns
Total Returns (Price + Dividend) stock-summary
Dividend Yield (0.13%)
TimePeriod
Price Return
Dividend Return
Total Return
3 Months
3.92%
0%
3.92%
6 Months
11.71%
0%
11.71%
1 Year
5.92%
0.14%
6.06%
2 Years
-30.46%
0.17%
-30.29%
3 Years
-3.83%
0.30%
-3.53%
4 Years
215.49%
1.38%
216.87%
5 Years
550.15%
3.34%
553.49%

Latest dividend: 0.85 per share ex-dividend date: Aug-26-2025

Risk Adjusted Returns v/s stock-summary
Returns Beta
Icon
Beta has not been calculated since enough price history is not available
stock-summaryNews & Corporate Actions

News

JBM Auto Gains 0.39%: Margin Pressures and Debt Weigh on Q1 Results

Key Events This Week

27 Jul: Stock opens strong at Rs.665.25 (+1.36%) alongside Sensex rally

30 Jul: Q1 FY27 results reveal profit growth masked by margin pressures and rising debt

31 Jul: Negative financial trend reported amid margin pressures; stock dips 2.87%

31 Jul: Week closes at Rs.658.90, up 0.39% for the week

Announcements stock-summary

JBM Auto Limited - Scheme of Arrangement

31-Oct-2019 | Source : NSE

Scheme of Arrangement Disclosure under Regulation 30 of SEBI (Listing Obligations and Disclosure

JBM Auto Limited - Updates

09-Oct-2019 | Source : NSE

JBM Auto Limited has informed the Exchange regarding 'Disclosure under regulation 30 of SEBI (Listing Obligations and Disclosure Requirements) Regulations, 2015'.

Shareholders meeting

16-Sep-2019 | Source : NSE

JBM Auto Limited has submitted the Exchange a copy Srutinizers report of Annual General Meeting held on September 14, 2019. Further, the company has informed the Exchange regarding voting results.

Corporate Actions stock-summary

stock-summary
BOARD MEETING

No Upcoming Board Meetings

stock-summary
DIVIDEND

JBM Auto Ltd has declared 85% dividend, ex-date: 26 Aug 25

stock-summary
SPLITS

JBM Auto Ltd has announced 1:2 stock split, ex-date: 31 Jan 25

stock-summary
BONUS

JBM Auto Ltd has announced 1:1 bonus issue, ex-date: 08 Oct 14

stock-summary
RIGHTS

No Rights history available

stock-summaryKey Factors

Quality key factors stock-summary

Factor
Value
Sales Growth (5y)
21.20%
EBIT Growth (5y)
24.12%
EBIT to Interest (avg)
2.20
Debt to EBITDA (avg)
4.13
Net Debt to Equity (avg)
1.88
Sales to Capital Employed (avg)
1.36
Tax Ratio
23.91%
Dividend Payout Ratio
9.96%
Pledged Shares
0
Institutional Holding
2.19%
ROCE (avg)
11.21%
ROE (avg)
14.90%

Valuation key factors

Factor
Value
P/E Ratio
66
Industry P/E
38
Price to Book Value
10.00
EV to EBIT
32.94
EV to EBITDA
25.08
EV to Capital Employed
4.12
EV to Sales
2.91
PEG Ratio
5.17
Dividend Yield
0.13%
ROCE (Latest)
11.97%
ROE (Latest)
14.71%

Technicals key factors

Indicator
Weekly
Monthly
MACD
Mildly Bearish
Mildly Bullish
RSI
No Signal
Bearish
Bollinger Bands
Sideways
Mildly Bullish
Moving Averages
Mildly Bullish (Daily)
KST
Bullish
Mildly Bullish
Dow Theory
Mildly Bullish
No Trend
OBV
No Trend
No Trend
stock-summary Technical Indicator Scale: Bearish, Mildly Bearish, Sideways, Mildly Bullish, Bullish  Turned 
stock-summaryShareholding
Shareholding Snapshot : Jun 2026stock-summary
Shareholding Compare (%holding) stock-summary
Majority shareholders

Promoters

Pledged Promoter Holdings

None

Mutual Funds

Held by 17 Schemes (0.11%)

FIIs

Held by 88 FIIs (2.03%)

Promoter with highest holding

Smc Credits Limited (16.35%)

Highest Public shareholder

Zeal Impex And Traders Private Limited (7.72%)

Individual Investors Holdings

12.71%

stock-summaryFinancial
[
  {
    "link": "quarterly",
    "btn_text": "All Quarterly Results",
    "header": "Quarterly Results Snapshot (Consolidated) - Jun'26 - QoQ",
    "rhs": [
      {
        "prefix": "Net Sales ",
        "suffix": "QoQ Growth in quarter ended Jun 2026 is -22.13% vs 14.76% in Mar 2026",
        "dir": -1
      },
      {
        "prefix": "Consolidated Net Profit ",
        "suffix": "QoQ Growth in quarter ended Jun 2026 is -43.16% vs 34.71% in Mar 2026",
        "dir": -1
      }
    ],
    "table": {
      "header": [
        "Jun'26",
        "Mar'26",
        "Change(%)"
      ],
      "body": [
        {
          "field": "Net Sales",
          "val1": "1,442.45",
          "val2": "1,852.27",
          "chgp": "-22.13%",
          "chgp_class": "negative"
        },
        {
          "field": "Operating Profit (PBDIT) excl Other Income",
          "val1": "163.39",
          "val2": "236.33",
          "chgp": "-30.86%",
          "chgp_class": "negative"
        },
        {
          "field": "Interest",
          "val1": "82.88",
          "val2": "108.22",
          "chgp": "-23.42%",
          "chgp_class": "positive"
        },
        {
          "field": "Exceptional Items",
          "val1": "0.00",
          "val2": "-0.05",
          "chgp": "100.00%",
          "chgp_class": "positive"
        },
        {
          "field": "Consolidate Net Profit",
          "val1": "42.20",
          "val2": "74.24",
          "chgp": "-43.16%",
          "chgp_class": "negative"
        },
        {
          "field": "Operating Profit Margin (Excl OI)",
          "val1": "11.33%",
          "val2": "12.76%",
          "chgp": "-1.43%",
          "chgp_class": "negative"
        }
      ]
    }
  },
  {
    "link": "half-yearly",
    "btn_text": "All Half Yearly Results",
    "header": "Half Yearly Results Snapshot (Consolidated) - Sep'25",
    "rhs": [
      {
        "prefix": "Net Sales ",
        "suffix": " Growth in half year ended Sep 2025 is 7.88% vs 11.63% in Sep 2024",
        "dir": -1
      },
      {
        "prefix": "Consolidated Net Profit ",
        "suffix": " Growth in half year ended Sep 2025 is 7.84% vs 11.44% in Sep 2024",
        "dir": -1
      }
    ],
    "table": {
      "header": [
        "Sep'25",
        "Sep'24",
        "Change(%)"
      ],
      "body": [
        {
          "field": "Net Sales",
          "val1": "2,622.12",
          "val2": "2,430.48",
          "chgp": "7.88%",
          "chgp_class": "positive"
        },
        {
          "field": "Operating Profit (PBDIT) excl Other Income",
          "val1": "295.42",
          "val2": "304.82",
          "chgp": "-3.08%",
          "chgp_class": "negative"
        },
        {
          "field": "Interest",
          "val1": "136.20",
          "val2": "111.48",
          "chgp": "22.17%",
          "chgp_class": "negative"
        },
        {
          "field": "Exceptional Items",
          "val1": "0.00",
          "val2": "0.00",
          "chgp": "",
          "chgp_class": "neutral"
        },
        {
          "field": "Consolidate Net Profit",
          "val1": "89.43",
          "val2": "82.93",
          "chgp": "7.84%",
          "chgp_class": "positive"
        },
        {
          "field": "Operating Profit Margin (Excl OI)",
          "val1": "11.27%",
          "val2": "12.54%",
          "chgp": "-1.27%",
          "chgp_class": "negative"
        }
      ]
    }
  },
  {
    "link": "nine-monthly",
    "btn_text": "All Nine Monthly Results",
    "header": "Nine Monthly Results Snapshot (Consolidated) - Dec'25",
    "rhs": [
      {
        "prefix": "Net Sales ",
        "suffix": "YoY Growth in nine months ended Dec 2025 is 10.70% vs 8.61% in Dec 2024",
        "dir": 1
      },
      {
        "prefix": "Consolidated Net Profit ",
        "suffix": "YoY Growth in nine months ended Dec 2025 is 6.62% vs 10.15% in Dec 2024",
        "dir": -1
      }
    ],
    "table": {
      "header": [
        "Dec'25",
        "Dec'24",
        "Change(%)"
      ],
      "body": [
        {
          "field": "Net Sales",
          "val1": "4,236.10",
          "val2": "3,826.63",
          "chgp": "10.70%",
          "chgp_class": "positive"
        },
        {
          "field": "Operating Profit (PBDIT) excl Other Income",
          "val1": "468.55",
          "val2": "479.83",
          "chgp": "-2.35%",
          "chgp_class": "negative"
        },
        {
          "field": "Interest",
          "val1": "210.02",
          "val2": "179.96",
          "chgp": "16.70%",
          "chgp_class": "negative"
        },
        {
          "field": "Exceptional Items",
          "val1": "-9.64",
          "val2": "0.00",
          "chgp": "",
          "chgp_class": "neutral"
        },
        {
          "field": "Consolidate Net Profit",
          "val1": "144.54",
          "val2": "135.57",
          "chgp": "6.62%",
          "chgp_class": "positive"
        },
        {
          "field": "Operating Profit Margin (Excl OI)",
          "val1": "11.06%",
          "val2": "12.54%",
          "chgp": "-1.48%",
          "chgp_class": "negative"
        }
      ]
    }
  },
  {
    "link": "annual",
    "btn_text": "All Annual Results",
    "header": "Annual Results Snapshot (Consolidated) - Mar'26",
    "rhs": [
      {
        "prefix": "Net Sales ",
        "suffix": "YoY Growth in year ended Mar 2026 is 11.26% vs 9.24% in Mar 2025",
        "dir": 1
      },
      {
        "prefix": "Consolidated Net Profit ",
        "suffix": "YoY Growth in year ended Mar 2026 is 8.36% vs 12.91% in Mar 2025",
        "dir": -1
      }
    ],
    "table": {
      "header": [
        "Mar'26",
        "Mar'25",
        "Change(%)"
      ],
      "body": [
        {
          "field": "Net Sales",
          "val1": "6,088.37",
          "val2": "5,472.33",
          "chgp": "11.26%",
          "chgp_class": "positive"
        },
        {
          "field": "Operating Profit (PBDIT) excl Other Income",
          "val1": "704.90",
          "val2": "676.81",
          "chgp": "4.15%",
          "chgp_class": "positive"
        },
        {
          "field": "Interest",
          "val1": "318.24",
          "val2": "246.95",
          "chgp": "28.87%",
          "chgp_class": "negative"
        },
        {
          "field": "Exceptional Items",
          "val1": "-9.69",
          "val2": "0.00",
          "chgp": "",
          "chgp_class": "neutral"
        },
        {
          "field": "Consolidate Net Profit",
          "val1": "218.78",
          "val2": "201.91",
          "chgp": "8.36%",
          "chgp_class": "positive"
        },
        {
          "field": "Operating Profit Margin (Excl OI)",
          "val1": "11.58%",
          "val2": "12.37%",
          "chgp": "-0.79%",
          "chgp_class": "negative"
        }
      ]
    }
  }
]

Quarterly Results Snapshot (Consolidated) - Jun'26 - QoQstock-summary

Jun'26
Mar'26
Change(%)
Net Sales
1,442.45
1,852.27
-22.13%
Operating Profit (PBDIT) excl Other Income
163.39
236.33
-30.86%
Interest
82.88
108.22
-23.42%
Exceptional Items
0.00
-0.05
100.00%
Consolidate Net Profit
42.20
74.24
-43.16%
Operating Profit Margin (Excl OI)
11.33%
12.76%
-1.43%
Values in Rs Cr.
Direction Arrows
Net Sales

QoQ Growth in quarter ended Jun 2026 is -22.13% vs 14.76% in Mar 2026

Direction Arrows
Consolidated Net Profit

QoQ Growth in quarter ended Jun 2026 is -43.16% vs 34.71% in Mar 2026

Half Yearly Results Snapshot (Consolidated) - Sep'25stock-summary

Sep'25
Sep'24
Change(%)
Net Sales
2,622.12
2,430.48
7.88%
Operating Profit (PBDIT) excl Other Income
295.42
304.82
-3.08%
Interest
136.20
111.48
22.17%
Exceptional Items
0.00
0.00
Consolidate Net Profit
89.43
82.93
7.84%
Operating Profit Margin (Excl OI)
11.27%
12.54%
-1.27%
Values in Rs Cr.
Direction Arrows
Net Sales

Growth in half year ended Sep 2025 is 7.88% vs 11.63% in Sep 2024

Direction Arrows
Consolidated Net Profit

Growth in half year ended Sep 2025 is 7.84% vs 11.44% in Sep 2024

Nine Monthly Results Snapshot (Consolidated) - Dec'25stock-summary

Dec'25
Dec'24
Change(%)
Net Sales
4,236.10
3,826.63
10.70%
Operating Profit (PBDIT) excl Other Income
468.55
479.83
-2.35%
Interest
210.02
179.96
16.70%
Exceptional Items
-9.64
0.00
Consolidate Net Profit
144.54
135.57
6.62%
Operating Profit Margin (Excl OI)
11.06%
12.54%
-1.48%
Values in Rs Cr.
Direction Arrows
Net Sales

YoY Growth in nine months ended Dec 2025 is 10.70% vs 8.61% in Dec 2024

Direction Arrows
Consolidated Net Profit

YoY Growth in nine months ended Dec 2025 is 6.62% vs 10.15% in Dec 2024

Annual Results Snapshot (Consolidated) - Mar'26stock-summary

Mar'26
Mar'25
Change(%)
Net Sales
6,088.37
5,472.33
11.26%
Operating Profit (PBDIT) excl Other Income
704.90
676.81
4.15%
Interest
318.24
246.95
28.87%
Exceptional Items
-9.69
0.00
Consolidate Net Profit
218.78
201.91
8.36%
Operating Profit Margin (Excl OI)
11.58%
12.37%
-0.79%
Values in Rs Cr.
Direction Arrows
Net Sales

YoY Growth in year ended Mar 2026 is 11.26% vs 9.24% in Mar 2025

Direction Arrows
Consolidated Net Profit

YoY Growth in year ended Mar 2026 is 8.36% vs 12.91% in Mar 2025

stock-summaryCompany CV
About JBM Auto Ltd stock-summary
stock-summary
JBM Auto Ltd
Small Cap
Auto Components & Equipments
JBM Auto Limited is the flagship company of JBM Group that has a diversified portfolio in the field of automotive, engineering & design services and renewables, with an infrastructure of manufacturing plants and engineering & design centres globally. The Company is engaged in the manufacturing of tools, dies and moulds.
Company Coordinates stock-summary
Company Details
601 Hemkunt Chambers, 89 Nehru Place New Delhi New Delhi : 110019
stock-summary
Tel: 91-11-26427104
stock-summary
corp@jbm.co.in
Registrar Details
MCS Ltd , F-65, , Okhla Industrial Area, Phase - I, New Delhi