
Compare Jindal Poly Film with Similar Stocks
Dashboard
Poor long term growth as Net Sales has grown by an annual rate of -3.97% and Operating profit at -173.00% over the last 5 years
The company has declared negative results for the last 3 consecutive quarters
Risky - Negative Operating Profits
Falling Participation by Institutional Investors
Stock DNA
Packaging
INR 2,726 Cr (Small Cap)
NA (Loss Making)
35
0.94%
-0.01
-1.52%
0.67
Total Returns (Price + Dividend) 
Latest dividend: 5.90198252688172 per share ex-dividend date: Sep-23-2025
Risk Adjusted Returns v/s
Returns Beta

News
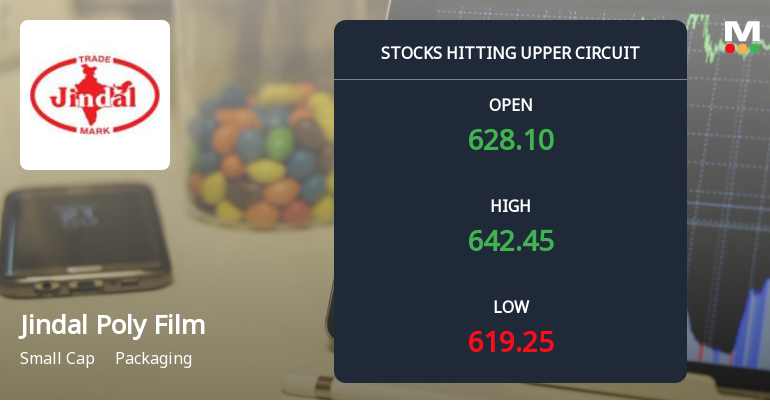
Jindal Poly Films Ltd Locks at Upper Circuit With 5% Gain Amid Delivery Drop and Mixed Technical Signals
At Rs 642.95, the rally in Jindal Poly Films Ltd was halted not by a lack of buyers but by the exchange-imposed 5% price band ceiling on 2 Jul 2026. The stock locked at its upper circuit with a 4.43% gain, reflecting unfilled demand as sellers remained absent at these elevated levels.
Read full news article
Jindal Poly Films Ltd Downgraded to Strong Sell Amid Deteriorating Fundamentals and Bearish Technicals
Jindal Poly Films Ltd has seen its investment rating downgraded from Sell to Strong Sell as of 1 July 2026, reflecting deteriorating fundamentals and a shift towards bearish technical indicators. The packaging sector company’s Mojo Score has dropped to 20.0, signalling heightened risk for investors amid sustained financial underperformance and weakening market sentiment.
Read full news article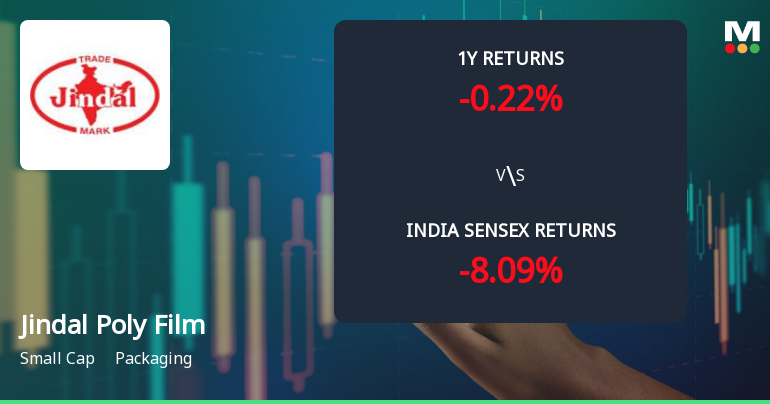
Jindal Poly Films Ltd Faces Technical Momentum Shift Amid Mixed Indicator Signals
Jindal Poly Films Ltd, a small-cap player in the packaging sector, has experienced a notable shift in its technical momentum, moving from a mildly bullish to a mildly bearish stance. This change is underscored by a complex interplay of technical indicators including MACD, RSI, Bollinger Bands, and moving averages, signalling a cautious outlook for investors amid volatile price action.
Read full news article Announcements
Jindal Poly Films Limited - Other General Purpose
09-Dec-2019 | Source : NSEJindal Poly Films Limited has informed the Exchange regarding Related Party Transactions- September30,2019.
Jindal Poly Films Limited - Outcome of Board Meeting
14-Nov-2019 | Source : NSEJindal Poly Films Limited has informed the Exchange regarding Board meeting held on November 13, 2019.
Jindal Poly Films Limited - Updates
16-Oct-2019 | Source : NSEJindal Poly Films Limited has informed the Exchange regarding 'Compliance Certificate under Regulation 74(5) for the quarter ended September 30, 2019'.
Corporate Actions

No Upcoming Board Meetings

Jindal Poly Films Ltd has declared 59% dividend, ex-date: 23 Sep 25

No Splits history available

Jindal Poly Films Ltd has announced 1:1 bonus issue, ex-date: 22 Oct 10

No Rights history available
Quality key factors
Valuation key factors
Technicals key factors
 Technical Indicator Scale: Bearish, Mildly Bearish, Sideways, Mildly Bullish, Bullish Turned
 Shareholding Snapshot : Mar 2026
Shareholding Compare (%holding)
Promoters
None
Held by 2 Schemes (0.0%)
Held by 25 FIIs (2.55%)
Concatenate Flexi Films Advest Private Limited (62.8%)
Monet Securities Private Ltd (8.99%)
9.51%
Quarterly Results Snapshot (Consolidated) - Dec'25 - QoQ

QoQ Growth in quarter ended Dec 2025 is -9.44% vs -55.08% in Sep 2025

QoQ Growth in quarter ended Dec 2025 is -653.79% vs -134.69% in Sep 2025
Half Yearly Results Snapshot (Consolidated) - Sep'25
Growth in half year ended Sep 2025 is -47.96% vs 36.39% in Sep 2024
Growth in half year ended Sep 2025 is -91.54% vs 159.26% in Sep 2024
Nine Monthly Results Snapshot (Consolidated) - Dec'25
YoY Growth in nine months ended Dec 2025 is -54.54% vs 30.92% in Dec 2024
YoY Growth in nine months ended Dec 2025 is -125.05% vs 219.54% in Dec 2024
Annual Results Snapshot (Consolidated) - Mar'25
YoY Growth in year ended Mar 2025 is 18.84% vs -16.42% in Mar 2024
YoY Growth in year ended Mar 2025 is 53.55% vs -77.59% in Mar 2024
About Jindal Poly Films Ltd

Company Coordinates


