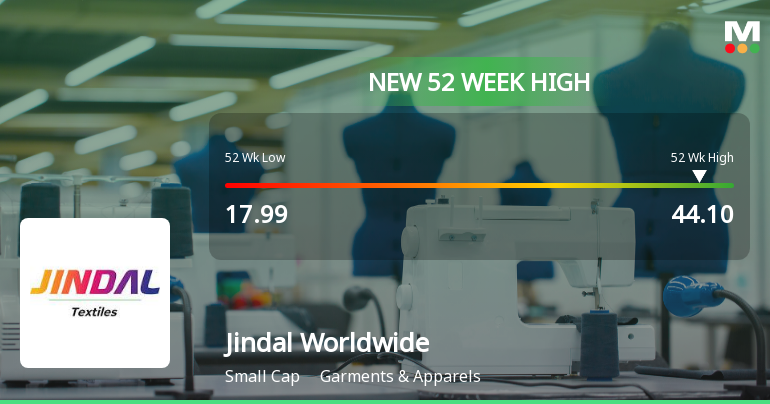
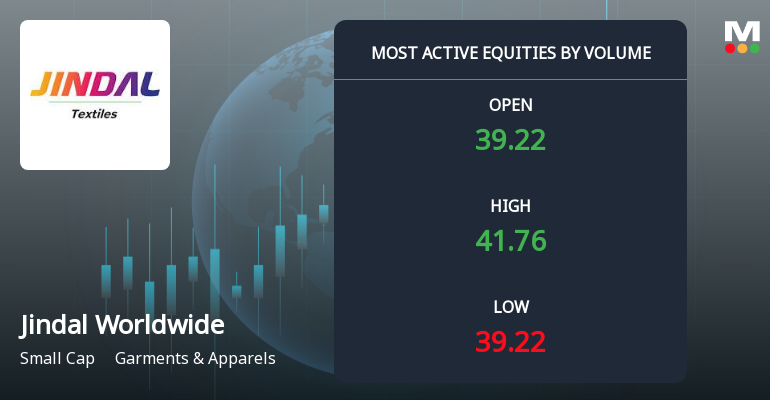
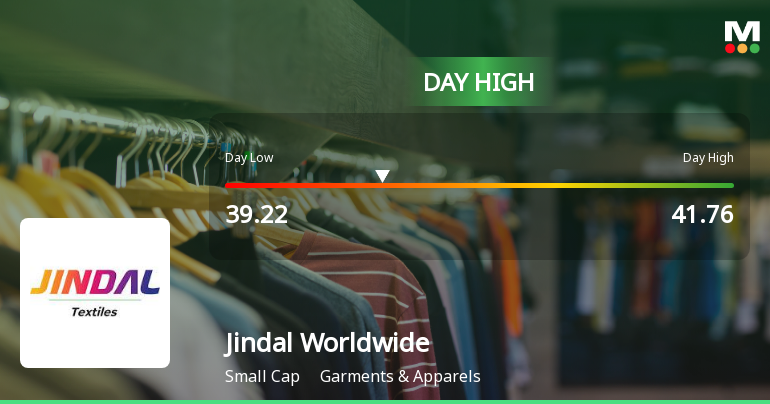
Jindal Worldwide

  • Market Cap: Small Cap
  • Industry: Garments & Apparels
  • ISIN: INE247D01039
  • NSEID: JINDWORLD
  • BSEID: 531543
INR
42.38
4.04 (10.54%)
BSENSE

Sep 01, 02:06 PM

BSE+NSE Vol: 9.22 cr

  • Price Points
  • Score
  • Mojo Parameters
  • Total Return
  • News and Corporate Actions
  • Key factors
  • Shareholding
  • Financials
  • CompanyCV
stock-summaryPrice Point
High/Low

1Day

52 Week

Valuation
Technical
Day's Volume

CASH

9.22 cr (1,845.62%) Volume

Shareholding (Jun 2026)

FII

0.09%

Held by 9 FIIs

DII

0.00%

Held by 0 DIIs

Promoter

61.76%

Why is Jindal Worldwide Ltd falling/rising?

01-Sep-2026

As of 31-Aug, Jindal Worldwide Ltd's stock price is rising to 38.34, driven by strong recent performance, positive financial results, and increased investor interest. The stock has outperformed the Sensex and is trading above its moving averages, indicating a robust upward trend.

As of 31-Aug, Jindal Worldwide Ltd's stock price is rising, currently at 38.34, with a change of 0.61 (1.62%) upwards. This upward movement can be attributed to several positive factors. Over the past week, the stock has outperformed the benchmark Sensex, gaining 7.24% while the Sensex fell by 0.53%. Additionally, the stock has shown a strong performance over the last three days, with a total increase of 9.68% during this period.<BR><BR>The stock is also trading above its moving averages across various time frames, including the 5-day, 20-day, 50-day, 100-day, and 200-day averages, indicating a strong upward trend. Furthermore, there has been a notable increase in investor participation, with delivery volume rising by 76.33% compared to the 5-day average, suggesting heightened interest in the stock.<BR><BR>Financially, Jindal Worldwide Ltd has reported positive results, with a profit after tax of Rs 58.53 crore, reflecting a growth of 48.33% over the last six months. The company maintains a low debt-equity ratio of 0.65 times and has cash and cash equivalents at their highest level of Rs 358.12 crore. These factors contribute to an attractive valuation, as the stock is trading at a discount compared to its peers' average historical valuations.<BR><BR>In summary, the combination of strong recent performance, positive financial results, and increased investor interest are driving the rise in Jindal Worldwide Ltd's stock price.

View full answer

Who are in the management team of Jindal Worldwide?

01-Sep-2026

The management team of Jindal Worldwide includes Chairman Yamunadutt Agrawal, Vice Chairman Amit Agrawal, CFO Vikram Oza, and several independent directors, along with Company Secretary Chetna Darajiya, all contributing to the company's strategic direction and governance.

The management team of Jindal Worldwide includes the following individuals:<BR><BR>1. **Yamunadutt Agrawal** - Chairman & Director<BR>2. **Amit Agrawal** - Vice Chairman & Managing Director<BR>3. **Rajesh Jain** - Independent Director<BR>4. **Vikram Oza** - Director & Chief Financial Officer<BR>5. **Ashish Shah** - Independent Director<BR>6. **Jasdev Kaur Rait** - Independent Director<BR>7. **Sidharath Shrawankumar Kapur** - Independent Director<BR>8. **Mukesh Gupta** - Independent Director<BR>9. **Chetna Darajiya** - Company Secretary & Compliance Officer<BR><BR>This team plays a crucial role in the strategic direction and governance of the company.

View full answer

What does Jindal Worldwide do?

01-Sep-2026

Jindal Worldwide Ltd is a Small Cap company in the Garments & Apparels industry, incorporated in 1986, with recent quarterly net sales of 555 Cr and net profit of 32 Cr. The company has a market cap of INR 3,955 Cr and key financial metrics include a P/E of 45.00 and a debt-equity ratio of 0.23.

Overview: <BR>Jindal Worldwide Ltd operates in the Garments & Apparels industry and is categorized as a Small Cap company.<BR><BR>History: <BR>Jindal Worldwide Ltd was incorporated on September 2, 1986, originally as 'Jindal (India) Textiles Mills Private Limited'. The company commenced operations in 1990-91, transitioned to a Limited Company in 1993, and was renamed 'Jindal Worldwide Limited' in April 1995. The latest quarterly results reported net sales and net profit for June 2026.<BR><BR>Financial Snapshot: <BR>Net Sales: 555 Cr (Quarterly Results - Jun 2026) <BR>Net Profit: 32 Cr (Quarterly Results - Jun 2026) <BR>Market Cap: INR 3,955 Cr (Small Cap)<BR><BR>Key Metrics: <BR>P/E: 45.00 <BR>Industry P/E: 28 <BR>Dividend Yield: 0.00% <BR>Debt-Equity: 0.23 <BR>Return on Equity: 8.11% <BR>Price to Book: 4.42 <BR><BR>Contact Details: <BR>Address: Jindal House Opp D Mart, IOC Petrol Pump Lane Satellite Ahmedabad Gujarat : 380015 <BR>Tel: 91-79-71001500/557 <BR>Email: csjindal@jindaltextiles.com <BR>Website: http://www.jindaltextiles.com

View full answer

Who are the peers of the Jindal Worldwide?

01-Sep-2026

Jindal Worldwide's peers include Gokaldas Exports, PDS, Alok Industries, and others, with varying management risks and growth rates. Jindal Worldwide has a 1-year return of 2.82%, higher than Alok Industries but lower than Nitin Spinners, which leads with an 80.65% return.

Peers: The peers of Jindal Worldwide are Gokaldas Exports, PDS, Alok Industries, Raymond Lifestyl, Sanathan Textile, Lux Industries, Nitin Spinners, Filatex India, Kewal Kir.Cloth, and Baazar Style.<BR><BR>Quality Snapshot: Excellent management risk is observed at Kewal Kir.Cloth and Nitin Spinners, while Good management risk is found at PDS and Nitin Spinners. Average management risk is noted at Gokaldas Exports, Raymond Lifestyl, Jindal Worldwide, Lux Industries, and Filatex India. Below Average management risk is seen at Sanathan Textile and Baazar Style, while Alok Industries does not qualify. Growth is Excellent at Gokaldas Exports and Kewal Kir.Cloth, Average at PDS, and Below Average at Raymond Lifestyl, Jindal Worldwide, Sanathan Textile, Lux Industries, Nitin Spinners, and Baazar Style, with Alok Industries not qualifying. Capital Structure is Excellent at Kewal Kir.Cloth and Filatex India, Good at Gokaldas Exports, PDS, and Nitin Spinners, Average at Jindal Worldwide and Lux Industries, and Below Average at Sanathan Textile and Baazar Style, with Alok Industries not qualifying.<BR><BR>Return Snapshot: Nitin Spinners has the highest 1-year return at 80.65%, while Alok Industries has the lowest at -51.23%. Jindal Worldwide's 1-year return is 2.82%, which is significantly higher than Alok Industries but lower than Nitin Spinners. Additionally, peers with negative six-month returns include Alok Industries, Raymond Lifestyl, and Sanathan Textile.

View full answer

How big is Jindal Worldwide?

01-Sep-2026

As of 31st August, Jindal Worldwide Ltd has a market capitalization of 3,955.00 Cr, with net sales of 2,300.36 Cr and a net profit of 84.77 Cr in the latest four quarters. The company reported shareholder's funds of 860.39 Cr and total assets of 1,658.90 Cr for the annual period ending in March 2026.

As of 31st August, Jindal Worldwide Ltd has a market capitalization of 3,955.00 Cr, categorizing it as a Small Cap company.<BR><BR>In the latest four quarters, Jindal Worldwide reported net sales of 2,300.36 Cr and a net profit of 84.77 Cr.<BR><BR>For the latest annual period ending in March 2026, the company had shareholder's funds amounting to 860.39 Cr and total assets of 1,658.90 Cr.

View full answer

Should I buy, sell or hold Jindal Worldwide Ltd?

31-Aug-2026

When is the next results date for Jindal Worldwide Ltd?

24-Jul-2026

The next results date for Jindal Worldwide Ltd is July 31, 2026.

The next results date for Jindal Worldwide Ltd is scheduled for July 31, 2026.

View full answer

Are Jindal Worldwide Ltd latest results good or bad?

26-May-2026

Jindal Worldwide Ltd's latest Q4 FY26 results are strong, with a net profit increase of 82.34% and revenue growth of 20.31%, indicating a positive turnaround. However, ongoing structural challenges and a significant stock decline over the past year suggest caution for investors.

Jindal Worldwide Ltd's latest results for Q4 FY26 indicate a strong performance, showcasing significant improvements compared to previous quarters. The company reported a net profit of ₹26.13 crores, which is an impressive 82.34% increase quarter-on-quarter. Revenue also saw a robust growth of 20.31%, reaching ₹640.18 crores, marking the highest quarterly revenue in recent history.<BR><BR>Additionally, the operating margin improved to 6.44%, up from 4.18% in the previous quarter, and the PAT margin increased to 4.08%, reflecting better operational efficiency and cost management. These results suggest a notable turnaround for the company, especially considering the challenges it has faced in the competitive textile sector.<BR><BR>However, despite these positive quarterly results, Jindal Worldwide has experienced structural challenges over the years, including modest long-term sales growth of just 5.81% and declining return metrics. The stock has also underperformed significantly over the past year, declining nearly 50%, which raises concerns about its sustainability moving forward.<BR><BR>In summary, while the latest quarterly results are good and indicate recovery, the broader context of ongoing challenges and historical performance suggests caution for investors.

View full answer

How has been the historical performance of Jindal Worldwide?

17-Nov-2025

Jindal Worldwide's historical performance has shown fluctuations, with net sales reaching 2,288.07 Cr in March 2025, up from 1,814.09 Cr in March 2024, but lower than 2,559.16 Cr in March 2022. The company has demonstrated resilience with improved operating cash flow and stable profitability despite varying financial metrics.

Answer:<BR>The historical performance of Jindal Worldwide shows fluctuations in key financial metrics over the years, with notable changes in net sales, profits, and overall financial health.<BR><BR>Breakdown:<BR>Jindal Worldwide's net sales have varied significantly, reaching 2,288.07 Cr in March 2025, an increase from 1,814.09 Cr in March 2024, but lower than the 2,559.16 Cr recorded in March 2022. The total operating income followed a similar trend, peaking at 2,288.07 Cr in March 2025. The company's total expenditure, excluding depreciation, was 2,093.33 Cr in March 2025, up from 1,630.84 Cr in March 2024. Operating profit (PBDIT) for March 2025 was 197.45 Cr, slightly higher than 185.41 Cr in March 2024, but lower than the 239.77 Cr in March 2023. Profit before tax showed a modest increase to 103.64 Cr in March 2025 from 102.51 Cr in March 2024, while profit after tax remained relatively stable at 75.86 Cr in March 2025 compared to 75.66 Cr in March 2024. The company's total liabilities increased to 1,795.82 Cr in March 2025 from 1,740.39 Cr in March 2024, with total debt decreasing to 795.81 Cr in March 2025 from 883.08 Cr in March 2024. Total assets also rose to 1,795.82 Cr in March 2025, reflecting a healthy balance sheet. Cash flow from operating activities improved significantly to 167.00 Cr in March 2025 from just 5.00 Cr in March 2024, contributing to a net cash inflow of 23.00 Cr in March 2025. Overall, Jindal Worldwide has shown resilience with a gradual recovery in sales and profitability despite some fluctuations in its financial metrics.

View full answer

Is Jindal Worldwide technically bullish or bearish?

06-Nov-2025

As of November 4, 2025, Jindal Worldwide exhibits a bearish trend with moderate strength, supported by bearish Bollinger Bands and moving averages, despite a mildly bullish weekly MACD.

As of 4 November 2025, the technical trend has changed from mildly bearish to bearish. The current stance is bearish with moderate strength. The weekly MACD is mildly bullish, but the monthly MACD and KST are bearish, indicating a divergence in time frames. The Bollinger Bands are bearish on both weekly and monthly charts, and daily moving averages confirm a bearish outlook. The Dow Theory shows a mildly bearish trend on the weekly basis, while there is no clear trend on the monthly. Overall, the indicators suggest a bearish sentiment for Jindal Worldwide in the current market environment.

View full answer

Is Jindal Worldwide overvalued or undervalued?

31-Oct-2025

As of October 30, 2025, Jindal Worldwide is considered very attractive and undervalued with a PE ratio of 48.87, an EV to EBITDA of 22.12, and a ROCE of 12.53%, despite underperforming the Sensex with a return of -39.11% over the past year, suggesting a potential buying opportunity.

As of 30 October 2025, Jindal Worldwide's valuation grade has moved from attractive to very attractive, indicating a significant improvement in its perceived value. The company is currently considered undervalued. Key ratios include a PE ratio of 48.87, an EV to EBITDA of 22.12, and a ROCE of 12.53%. <BR><BR>In comparison to its peers, Jindal Worldwide's PE ratio is higher than K P R Mill Ltd, which stands at 44.77, and significantly higher than Vardhman Textile's 15.03. Despite its high valuation metrics, the PEG ratio of 0.00 suggests that the stock may be undervalued relative to its growth potential. Over the past year, Jindal Worldwide has underperformed the Sensex, with a return of -39.11% compared to the Sensex's 5.58%, reinforcing the notion that the stock may present a buying opportunity given its attractive valuation metrics.

View full answer

Who are the top shareholders of the Jindal Worldwide?

06-Jun-2025

The top shareholders of Jindal Worldwide include Amit Yamunadutt Agarwal, the largest individual shareholder with 19.4%, and Saroj Kailash Agarwal, the highest public shareholder at 13.62%. Individual investors hold 22.93% of the shares, while mutual funds and foreign institutional investors have minor holdings.

The top shareholders of Jindal Worldwide include the promoters, with Amit Yamunadutt Agarwal being the largest individual shareholder, holding 19.4% of the company. The highest public shareholder is Saroj Kailash Agarwal, who owns 13.62%. Additionally, individual investors collectively hold 22.93% of the shares. The company also has a small percentage of holdings from mutual funds and foreign institutional investors, but these are relatively minor compared to the promoter and public holdings.

View full answer

What is the bonus history of the Jindal Worldwide?

06-Jun-2025

Jindal Worldwide has announced a bonus issue in a 4:1 ratio, with an ex-date and record date set for February 28, 2025. Shareholders will receive four additional shares for every one share held.

Jindal Worldwide has announced a bonus issue in a ratio of 4:1, with the ex-date set for February 28, 2025. This means that for every one share held, shareholders will receive four additional shares. The record date for this bonus is also February 28, 2025. If you have any more questions about the company or its financial activities, feel free to ask!

View full answer

Has Jindal Worldwide declared dividend?

06-Jun-2025

Yes, Jindal Worldwide Ltd has declared a 20% dividend, amounting to ₹0.2 per share, with an ex-date of September 9, 2024. Despite recent declines in shorter periods, the company has shown significant positive total returns over the longer term.

Jindal Worldwide Ltd has declared a 20% dividend.<BR><BR>Dividend Details:<BR>- Percentage announced: 20%<BR>- Amount per share: 0.2<BR>- Ex-date: 09 Sep 2024<BR><BR>Dividend Yield: 0.07%.<BR><BR>Total Returns by Period:<BR>In the last 6 months, the price return was -24.04%, with a dividend return of 0%, resulting in a total return of -24.04%.<BR><BR>Over the past year, the price return was -11.18%, with a dividend return of 0.28%, leading to a total return of -10.9%.<BR><BR>In the last 2 years, the price return was -13.12%, with a dividend return of 0.60%, culminating in a total return of -12.52%.<BR><BR>For the 3-year period, the price return was 10.84%, with a dividend return of 1.04%, resulting in a total return of 11.88%.<BR><BR>In the last 4 years, the price return was 463.07%, with a dividend return of 5.17%, leading to a total return of 468.24%.<BR><BR>Over the past 5 years, the price return was 679.52%, with a dividend return of 6.76%, culminating in a total return of 686.28%.<BR><BR>Overall, Jindal Worldwide Ltd has declared a dividend while experiencing varying total returns over different periods, with significant positive returns over the longer term despite recent declines in shorter periods.

View full answer
iScoreScore
Click here to find our call on this stock
Strong Sell
Sell
Hold
Buy
Strong Buy

Dashboard

1

Positive results in Jun 26

  • PAT(Latest six months) At Rs 58.53 cr has Grown at 48.33%
  • DEBT-EQUITY RATIO(HY) Lowest at 0.65 times
  • CASH AND CASH EQUIVALENTS(HY) Highest at Rs 358.12 cr
2

With ROCE of 11, it has a Attractive valuation with a 3.8 Enterprise value to Capital Employed

3

Market Beating Performance

stock-summaryMojo Parameters

Mojo Parameters

Loading Valuation Snapshot...

Stock DNA

stock-summary
Industry

Garments & Apparels

stock-summary
Market cap

INR 4,249 Cr (Small Cap)

stock-summary
P/E

45.00

stock-summary
Industry P/E

28

stock-summary
Dividend Yield

0.00%

stock-summary
Debt Equity

0.23

stock-summary
Return on Equity

8.11%

stock-summary
Price to Book

4.46

Revenue and Profits:
Net Sales:
555 Cr
(Quarterly Results - Jun 2026)
Net Profit:
32 Cr
stock-summaryTotal Returns
Total Returns (Price + Dividend) stock-summary
Dividend Yield (0%)
TimePeriod
Price Return
Dividend Return
Total Return
3 Months
39.13%
0%
39.13%
6 Months
71.93%
0%
71.93%
1 Year
15.6%
0%
15.6%
2 Years
-43.59%
0%
-43.59%
3 Years
-45.47%
0.05%
-45.42%
4 Years
1.75%
0.15%
1.9%
5 Years
233.7%
0.57%
234.27%

Latest dividend: 0.04 per share ex-dividend date: Sep-09-2024

Risk Adjusted Returns v/s stock-summary
Returns Beta
Icon
Beta has not been calculated since enough price history is not available
stock-summaryNews & Corporate Actions

Announcements stock-summary

Disclosure Under Regulation 30 Of The Securities And Exchange Board Of India (Listing Obligations And Disclosure Requirements) Regulations 2015 : For Grant Of Corporate Guarantee

29-Aug-2026 | Source : BSE

Please find attached the document about details pertaining to the grant of corporate Guarantee

Clarification sought from Jindal Worldwide Ltd

28-Aug-2026 | Source : BSE

The Exchange has sought clarification from Jindal Worldwide Ltd on August 28 2026 with reference to Movement in Volume.

The reply is awaited.

Disclosure Under Regulation 30 Of The SEBI (Listing Obligations And Disclosure Requirements) Regulations 2015 (Listing Regulations) - For Increase In Volume

28-Aug-2026 | Source : BSE

Clarification for the increase in volume

Corporate Actions stock-summary

stock-summary
BOARD MEETING

No Upcoming Board Meetings

stock-summary
DIVIDEND

Jindal Worldwide Ltd has declared 20% dividend, ex-date: 09 Sep 24

stock-summary
SPLITS

Jindal Worldwide Ltd has announced 1:5 stock split, ex-date: 31 Oct 18

stock-summary
BONUS

Jindal Worldwide Ltd has announced 4:1 bonus issue, ex-date: 28 Feb 25

stock-summary
RIGHTS

No Rights history available

stock-summaryKey Factors

Quality key factors stock-summary

Factor
Value
Sales Growth (5y)
1.18%
EBIT Growth (5y)
-3.31%
EBIT to Interest (avg)
3.30
Debt to EBITDA (avg)
3.74
Net Debt to Equity (avg)
0.23
Sales to Capital Employed (avg)
1.63
Tax Ratio
20.87%
Dividend Payout Ratio
0
Pledged Shares
18.90%
Institutional Holding
0.09%
ROCE (avg)
13.93%
ROE (avg)
13.29%

Valuation key factors

Factor
Value
P/E Ratio
45
Industry P/E
28
Price to Book Value
4.46
EV to EBIT
37.44
EV to EBITDA
32.56
EV to Capital Employed
3.81
EV to Sales
1.76
PEG Ratio
3.58
Dividend Yield
NA
ROCE (Latest)
11.04%
ROE (Latest)
8.11%

Technicals key factors

Indicator
Weekly
Monthly
MACD
Bullish
Mildly Bullish
RSI
No Signal
No Signal
Bollinger Bands
Bullish
Mildly Bearish
Moving Averages
Bullish (Daily)
KST
Bullish
Bearish
Dow Theory
Mildly Bullish
Mildly Bullish
OBV
No Trend
Bullish
stock-summary Technical Indicator Scale: Bearish, Mildly Bearish, Sideways, Mildly Bullish, Bullish  Turned 
stock-summaryShareholding
Shareholding Snapshot : Jun 2026stock-summary
Shareholding Compare (%holding) stock-summary
Majority shareholders

Promoters

Pledged Promoter Holdings

18.9008

Mutual Funds

Held by 1 Schemes (0.0%)

FIIs

Held by 9 FIIs (0.09%)

Promoter with highest holding

Amit Yamunadutt Agarwal (19.4%)

Highest Public shareholder

Saroj Kailash Agrawal (12.62%)

Individual Investors Holdings

20.48%

stock-summaryFinancial
[
  {
    "link": "quarterly",
    "btn_text": "All Quarterly Results",
    "header": "Quarterly Results Snapshot (Consolidated) - Jun'26 - YoY",
    "rhs": [
      {
        "prefix": "Net Sales ",
        "suffix": "YoY Growth in quarter ended Jun 2026 is 2.74% vs 9.63% in Jun 2025",
        "dir": -1
      },
      {
        "prefix": "Consolidated Net Profit ",
        "suffix": "YoY Growth in quarter ended Jun 2026 is 85.78% vs -3.43% in Jun 2025",
        "dir": 1
      }
    ],
    "table": {
      "header": [
        "Jun'26",
        "Jun'25",
        "Change(%)"
      ],
      "body": [
        {
          "field": "Net Sales",
          "val1": "554.72",
          "val2": "539.90",
          "chgp": "2.74%",
          "chgp_class": "positive"
        },
        {
          "field": "Operating Profit (PBDIT) excl Other Income",
          "val1": "30.12",
          "val2": "40.33",
          "chgp": "-25.32%",
          "chgp_class": "negative"
        },
        {
          "field": "Interest",
          "val1": "8.01",
          "val2": "15.14",
          "chgp": "-47.09%",
          "chgp_class": "positive"
        },
        {
          "field": "Exceptional Items",
          "val1": "0.00",
          "val2": "0.00",
          "chgp": "",
          "chgp_class": "neutral"
        },
        {
          "field": "Consolidate Net Profit",
          "val1": "32.40",
          "val2": "17.44",
          "chgp": "85.78%",
          "chgp_class": "positive"
        },
        {
          "field": "Operating Profit Margin (Excl OI)",
          "val1": "5.43%",
          "val2": "7.47%",
          "chgp": "-2.04%",
          "chgp_class": "negative"
        }
      ]
    }
  },
  {
    "link": "half-yearly",
    "btn_text": "All Half Yearly Results",
    "header": "Half Yearly Results Snapshot (Consolidated) - Sep'25",
    "rhs": [
      {
        "prefix": "Net Sales ",
        "suffix": " Growth in half year ended Sep 2025 is 5.20% vs 31.86% in Sep 2024",
        "dir": -1
      },
      {
        "prefix": "Consolidated Net Profit ",
        "suffix": " Growth in half year ended Sep 2025 is -17.09% vs 33.84% in Sep 2024",
        "dir": -1
      }
    ],
    "table": {
      "header": [
        "Sep'25",
        "Sep'24",
        "Change(%)"
      ],
      "body": [
        {
          "field": "Net Sales",
          "val1": "1,113.24",
          "val2": "1,058.24",
          "chgp": "5.20%",
          "chgp_class": "positive"
        },
        {
          "field": "Operating Profit (PBDIT) excl Other Income",
          "val1": "70.91",
          "val2": "95.06",
          "chgp": "-25.41%",
          "chgp_class": "negative"
        },
        {
          "field": "Interest",
          "val1": "26.10",
          "val2": "30.76",
          "chgp": "-15.15%",
          "chgp_class": "positive"
        },
        {
          "field": "Exceptional Items",
          "val1": "0.00",
          "val2": "0.00",
          "chgp": "",
          "chgp_class": "neutral"
        },
        {
          "field": "Consolidate Net Profit",
          "val1": "29.35",
          "val2": "35.40",
          "chgp": "-17.09%",
          "chgp_class": "negative"
        },
        {
          "field": "Operating Profit Margin (Excl OI)",
          "val1": "6.37%",
          "val2": "8.98%",
          "chgp": "-2.61%",
          "chgp_class": "negative"
        }
      ]
    }
  },
  {
    "link": "nine-monthly",
    "btn_text": "All Nine Monthly Results",
    "header": "Nine Monthly Results Snapshot (Consolidated) - Dec'25",
    "rhs": [
      {
        "prefix": "Net Sales ",
        "suffix": "YoY Growth in nine months ended Dec 2025 is -2.21% vs 35.66% in Dec 2024",
        "dir": -1
      },
      {
        "prefix": "Consolidated Net Profit ",
        "suffix": "YoY Growth in nine months ended Dec 2025 is -18.89% vs 13.42% in Dec 2024",
        "dir": -1
      }
    ],
    "table": {
      "header": [
        "Dec'25",
        "Dec'24",
        "Change(%)"
      ],
      "body": [
        {
          "field": "Net Sales",
          "val1": "1,645.36",
          "val2": "1,682.54",
          "chgp": "-2.21%",
          "chgp_class": "negative"
        },
        {
          "field": "Operating Profit (PBDIT) excl Other Income",
          "val1": "93.14",
          "val2": "145.74",
          "chgp": "-36.09%",
          "chgp_class": "negative"
        },
        {
          "field": "Interest",
          "val1": "34.80",
          "val2": "47.30",
          "chgp": "-26.43%",
          "chgp_class": "positive"
        },
        {
          "field": "Exceptional Items",
          "val1": "0.00",
          "val2": "0.00",
          "chgp": "",
          "chgp_class": "neutral"
        },
        {
          "field": "Consolidate Net Profit",
          "val1": "43.68",
          "val2": "53.85",
          "chgp": "-18.89%",
          "chgp_class": "negative"
        },
        {
          "field": "Operating Profit Margin (Excl OI)",
          "val1": "5.66%",
          "val2": "8.66%",
          "chgp": "-3.00%",
          "chgp_class": "negative"
        }
      ]
    }
  },
  {
    "link": "annual",
    "btn_text": "All Annual Results",
    "header": "Annual Results Snapshot (Consolidated) - Mar'26",
    "rhs": [
      {
        "prefix": "Net Sales ",
        "suffix": "YoY Growth in year ended Mar 2026 is -0.11% vs 26.13% in Mar 2025",
        "dir": -1
      },
      {
        "prefix": "Consolidated Net Profit ",
        "suffix": "YoY Growth in year ended Mar 2026 is -7.62% vs -0.11% in Mar 2025",
        "dir": -1
      }
    ],
    "table": {
      "header": [
        "Mar'26",
        "Mar'25",
        "Change(%)"
      ],
      "body": [
        {
          "field": "Net Sales",
          "val1": "2,285.54",
          "val2": "2,288.07",
          "chgp": "-0.11%",
          "chgp_class": "negative"
        },
        {
          "field": "Operating Profit (PBDIT) excl Other Income",
          "val1": "134.34",
          "val2": "195.11",
          "chgp": "-31.15%",
          "chgp_class": "negative"
        },
        {
          "field": "Interest",
          "val1": "44.11",
          "val2": "59.99",
          "chgp": "-26.47%",
          "chgp_class": "positive"
        },
        {
          "field": "Exceptional Items",
          "val1": "0.00",
          "val2": "0.00",
          "chgp": "",
          "chgp_class": "neutral"
        },
        {
          "field": "Consolidate Net Profit",
          "val1": "69.81",
          "val2": "75.57",
          "chgp": "-7.62%",
          "chgp_class": "negative"
        },
        {
          "field": "Operating Profit Margin (Excl OI)",
          "val1": "5.88%",
          "val2": "8.53%",
          "chgp": "-2.65%",
          "chgp_class": "negative"
        }
      ]
    }
  }
]

Quarterly Results Snapshot (Consolidated) - Jun'26 - YoYstock-summary

Jun'26
Jun'25
Change(%)
Net Sales
554.72
539.90
2.74%
Operating Profit (PBDIT) excl Other Income
30.12
40.33
-25.32%
Interest
8.01
15.14
-47.09%
Exceptional Items
0.00
0.00
Consolidate Net Profit
32.40
17.44
85.78%
Operating Profit Margin (Excl OI)
5.43%
7.47%
-2.04%
Values in Rs Cr.
Direction Arrows
Net Sales

YoY Growth in quarter ended Jun 2026 is 2.74% vs 9.63% in Jun 2025

Direction Arrows
Consolidated Net Profit

YoY Growth in quarter ended Jun 2026 is 85.78% vs -3.43% in Jun 2025

Half Yearly Results Snapshot (Consolidated) - Sep'25stock-summary

Sep'25
Sep'24
Change(%)
Net Sales
1,113.24
1,058.24
5.20%
Operating Profit (PBDIT) excl Other Income
70.91
95.06
-25.41%
Interest
26.10
30.76
-15.15%
Exceptional Items
0.00
0.00
Consolidate Net Profit
29.35
35.40
-17.09%
Operating Profit Margin (Excl OI)
6.37%
8.98%
-2.61%
Values in Rs Cr.
Direction Arrows
Net Sales

Growth in half year ended Sep 2025 is 5.20% vs 31.86% in Sep 2024

Direction Arrows
Consolidated Net Profit

Growth in half year ended Sep 2025 is -17.09% vs 33.84% in Sep 2024

Nine Monthly Results Snapshot (Consolidated) - Dec'25stock-summary

Dec'25
Dec'24
Change(%)
Net Sales
1,645.36
1,682.54
-2.21%
Operating Profit (PBDIT) excl Other Income
93.14
145.74
-36.09%
Interest
34.80
47.30
-26.43%
Exceptional Items
0.00
0.00
Consolidate Net Profit
43.68
53.85
-18.89%
Operating Profit Margin (Excl OI)
5.66%
8.66%
-3.00%
Values in Rs Cr.
Direction Arrows
Net Sales

YoY Growth in nine months ended Dec 2025 is -2.21% vs 35.66% in Dec 2024

Direction Arrows
Consolidated Net Profit

YoY Growth in nine months ended Dec 2025 is -18.89% vs 13.42% in Dec 2024

Annual Results Snapshot (Consolidated) - Mar'26stock-summary

Mar'26
Mar'25
Change(%)
Net Sales
2,285.54
2,288.07
-0.11%
Operating Profit (PBDIT) excl Other Income
134.34
195.11
-31.15%
Interest
44.11
59.99
-26.47%
Exceptional Items
0.00
0.00
Consolidate Net Profit
69.81
75.57
-7.62%
Operating Profit Margin (Excl OI)
5.88%
8.53%
-2.65%
Values in Rs Cr.
Direction Arrows
Net Sales

YoY Growth in year ended Mar 2026 is -0.11% vs 26.13% in Mar 2025

Direction Arrows
Consolidated Net Profit

YoY Growth in year ended Mar 2026 is -7.62% vs -0.11% in Mar 2025

stock-summaryCompany CV
About Jindal Worldwide Ltd stock-summary
stock-summary
Jindal Worldwide Ltd
Small Cap
Garments & Apparels
Jindal Worldwide Limited (JWL), a part of Ahmedabad based Jindal Group was incorporated on September 2, 1986 as 'Jindal (India) Textiles Mills Private Limited '. The Company started its operations in 1990-91. Later in 1993 it got converted into a Limited Company and subsequently was rechristined as 'Jindal (India) Textiles Mills Limited'., Again in April, 1995, Company changed the name to 'Jindal Worldwide Limited'.
Company Coordinates stock-summary
Company Details
Jindal House Opp D Mart, IOC Petrol Pump Lane Satellite Ahmedabad Gujarat : 380015
stock-summary
Tel: 91-79-71001500/557
stock-summary
csjindal@jindaltextiles.com
Registrar Details
Cameo Corporate Services Ltd , Subramanian Buildings No 1 , Club House Road, Chennai