
Compare Jinkushal Indus. with Similar Stocks
Dashboard
High Management Efficiency with a high ROCE of 0%
The company is Net-Debt Free
Poor long term growth as Net Sales has grown by an annual rate of 0% and Operating profit at 0% over the last 5 years
Flat results in Mar 26
With ROCE of 9.5, it has a Fair valuation with a 1.9 Enterprise value to Capital Employed
Majority shareholders : Promoters
Total Returns (Price + Dividend) 
Jinkushal Indus. for the last several years.
Risk Adjusted Returns v/s
Returns Beta

News
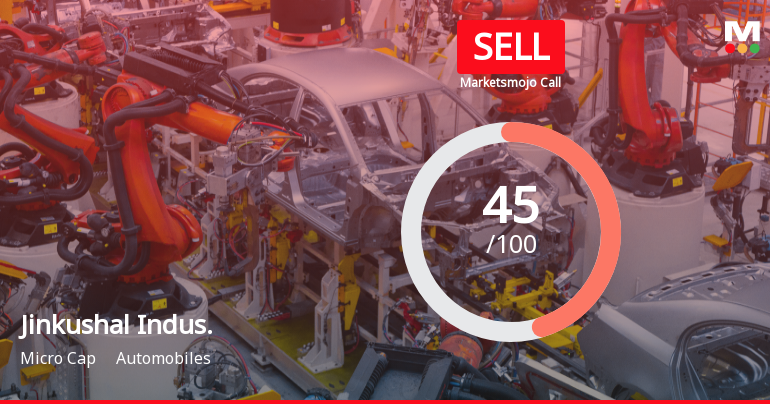
Jinkushal Industries Ltd Downgraded to Sell Amid Technical and Financial Concerns
Jinkushal Industries Ltd, a micro-cap player in the automobile sector, has seen its investment rating downgraded from Hold to Sell as of 8 July 2026. This shift reflects a combination of deteriorating technical indicators, stagnant financial performance, and valuation concerns, signalling caution for investors amid a challenging market environment.
Read full news article
Jinkushal Industries Ltd Locks at Lower Circuit With 5% Loss — Sellers Queue, No Buyers in Sight
At Rs 96.8, sellers were still queuing — but there were no buyers willing to take the other side. Jinkushal Industries Ltd locked at its lower circuit of 5% on 3 Jul 2026, with unfilled sell orders and a frozen price, reflecting persistent selling pressure in a micro-cap stock with limited liquidity.
Read full news article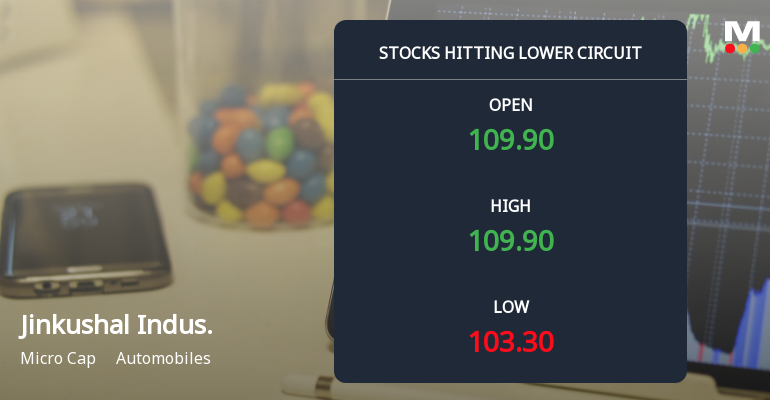
Jinkushal Industries Ltd Locks at Lower Circuit With 5.06% Loss — Sellers Queue, No Buyers in Sight
At Rs 101.85, sellers were still queuing — but there were no buyers willing to take the other side. Jinkushal Industries Ltd locked at its lower circuit of 5.06% on 2 Jul 2026, with unfilled sell orders and a frozen price, reflecting persistent selling pressure in a thinly traded micro-cap stock.
Read full news article Announcements
Closure of Trading Window
25-Jun-2026 | Source : BSEIntimation of Closure of Trading Window.
Announcement under Regulation 30 (LODR)-Earnings Call Transcript
15-Jun-2026 | Source : BSETranscript of the Analyst / Instituional Investor Meet
Announcement under Regulation 30 (LODR)-Analyst / Investor Meet - Outcome
12-Jun-2026 | Source : BSEOutcome of Q4 FY26 Earnings Call
Corporate Actions

No Upcoming Board Meetings

No Dividend history available

No Splits history available

No Bonus history available

No Rights history available
Quality key factors
Valuation key factors
Technicals key factors
 Technical Indicator Scale: Bearish, Mildly Bearish, Sideways, Mildly Bullish, Bullish Turned
 Shareholding Snapshot : Mar 2026
Shareholding Compare (%holding)
Promoters
None
Held by 0 Schemes
Held by 7 FIIs (0.82%)
Anil Kumar Jain (41.78%)
Royal Alpha Opportunity Fund (1.71%)
13.7%
Quarterly Results Snapshot (Standalone) - Mar'26 - QoQ

QoQ Growth in quarter ended Mar 2026 is 46.59% vs 73.79% in Dec 2025
QoQ Growth in quarter ended Mar 2026 is -76.98% vs 17.46% in Dec 2025
Half Yearly Results Snapshot (Standalone) - Sep'25
Not Applicable: The company has declared_date for only one period
Not Applicable: The company has declared_date for only one period
Nine Monthly Results Snapshot (Standalone) - Dec'25
Not Applicable: The company has declared_date for only one period
Not Applicable: The company has declared_date for only one period
Annual Results Snapshot (Standalone) - Mar'26

YoY Growth in year ended Mar 2026 is 47.92% vs -11.20% in Mar 2025
YoY Growth in year ended Mar 2026 is -22.64% vs -14.97% in Mar 2025
About Jinkushal Industries Ltd

Company Coordinates


