
Compare JITF Infra Logis with Similar Stocks
Dashboard
With a Negative Book Value, the company has a Weak Long Term Fundamental Strength
- Poor long term growth as Net Sales has grown by an annual rate of 24.76% and Operating profit at 0% over the last 5 years
- The company has a negative book value of Rs 513.28 crore
Risky - Negative Book Value
Despite the size of the company, domestic mutual funds hold only 0.02% of the company
Below par performance in long term as well as near term
Stock DNA
Other Utilities
INR 822 Cr (Micro Cap)
NA (Loss Making)
37
0.00%
-6.84
1.35%
-1.46
Total Returns (Price + Dividend) 
JITF Infra Logis for the last several years.
Risk Adjusted Returns v/s
Returns Beta

News

JITF Infra Logistics Ltd is Rated Strong Sell
JITF Infra Logistics Ltd is rated Strong Sell by MarketsMOJO, with this rating last updated on 12 May 2026. However, the analysis and financial metrics presented here reflect the stock’s current position as of 13 June 2026, providing investors with the latest insights into the company’s fundamentals, valuation, financial trends, and technical outlook.
Read full news article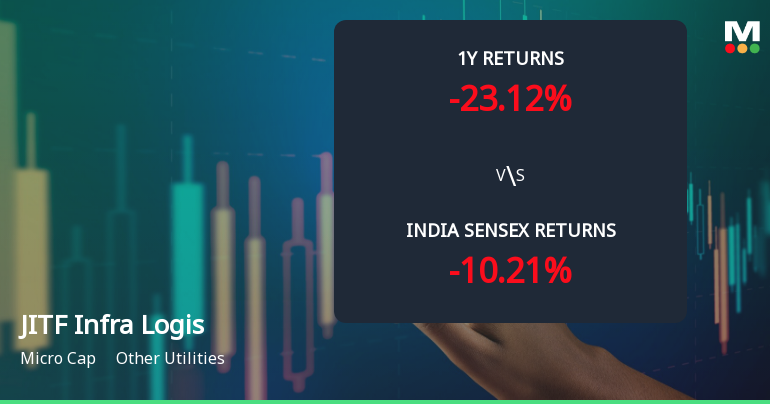
JITF Infra Logistics Ltd Faces Bearish Momentum Amid Technical Downgrade
JITF Infra Logistics Ltd, a micro-cap player in the Other Utilities sector, has experienced a notable shift in its technical momentum, with key indicators signalling a bearish trend. Despite a year-to-date return of 11.21%, the stock’s recent price action and technical parameters suggest increasing downside risks, prompting a downgrade to a Strong Sell rating by MarketsMOJO as of 8 May 2026.
Read full news article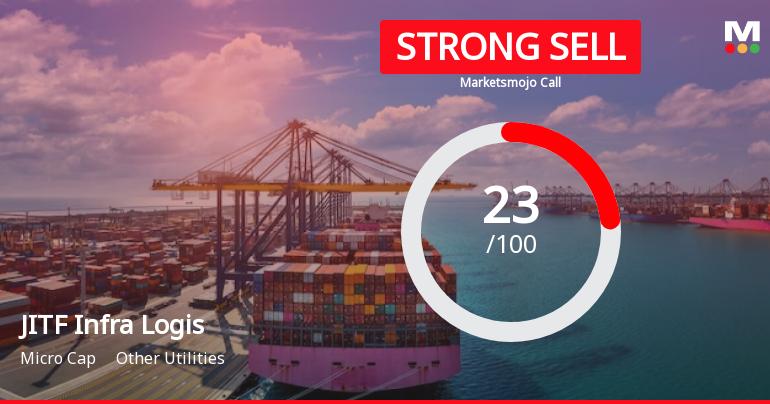
JITF Infra Logistics Ltd is Rated Strong Sell
JITF Infra Logistics Ltd is rated Strong Sell by MarketsMOJO, with this rating last updated on 12 May 2026. However, the analysis and financial metrics discussed here reflect the stock's current position as of 02 June 2026, providing investors with the latest insights into the company’s performance and outlook.
Read full news article Announcements
Compliances-Reg.24(A)-Annual Secretarial Compliance
13-May-2026 | Source : BSEAS ATTACHED
Board Meeting Outcome for Audited Financial Results (Standalone & Consolidated) Of The Company For The Quarter/ Year Ended 31St March 2026 Along With The Audit Report
12-May-2026 | Source : BSEAS ATTACHED
Audited Financial Results (Standalone & Consolidated) Of The Company For The Quarter/ Year Ended 31St March 2026 Along With The Audit Report
12-May-2026 | Source : BSEAS ATTACHED
Corporate Actions

No Upcoming Board Meetings

No Dividend history available

No Splits history available

No Bonus history available

No Rights history available
Quality key factors
Valuation key factors
Technicals key factors
 Technical Indicator Scale: Bearish, Mildly Bearish, Sideways, Mildly Bullish, Bullish Turned
 Shareholding Snapshot : Mar 2026
Shareholding Compare (%holding)
Promoters
None
Held by 6 Schemes (0.01%)
Held by 16 FIIs (1.95%)
Nalwa Sons Investments Limited (16.75%)
Cresta Fund Ltd (1.66%)
31.6%
Quarterly Results Snapshot (Consolidated) - Mar'26 - YoY

YoY Growth in quarter ended Mar 2026 is 14.07% vs 20.59% in Mar 2025

YoY Growth in quarter ended Mar 2026 is 39.66% vs -190.76% in Mar 2025
Half Yearly Results Snapshot (Consolidated) - Sep'25
Growth in half year ended Sep 2025 is 15.03% vs -25.16% in Sep 2024
Growth in half year ended Sep 2025 is -115.88% vs 1,790.85% in Sep 2024
Nine Monthly Results Snapshot (Consolidated) - Dec'25
YoY Growth in nine months ended Dec 2025 is 29.27% vs -21.51% in Dec 2024
YoY Growth in nine months ended Dec 2025 is -117.32% vs 6,061.27% in Dec 2024
Annual Results Snapshot (Consolidated) - Mar'26
YoY Growth in year ended Mar 2026 is 23.98% vs -10.66% in Mar 2025
YoY Growth in year ended Mar 2026 is -191.85% vs 47.98% in Mar 2025
About JITF Infra Logistics Ltd

Company Coordinates


