
Compare JK Lakshmi Cem. with Similar Stocks
Dashboard
High Management Efficiency with a high ROCE of 15.96%
Strong ability to service debt as the company has a low Debt to EBITDA ratio of 2.56 times
Poor long term growth as Operating profit has grown by an annual rate -0.75% of over the last 5 years
Flat results in Mar 26
With ROCE of 13.1, it has a Very Attractive valuation with a 1.7 Enterprise value to Capital Employed
High Institutional Holdings at 34.96%
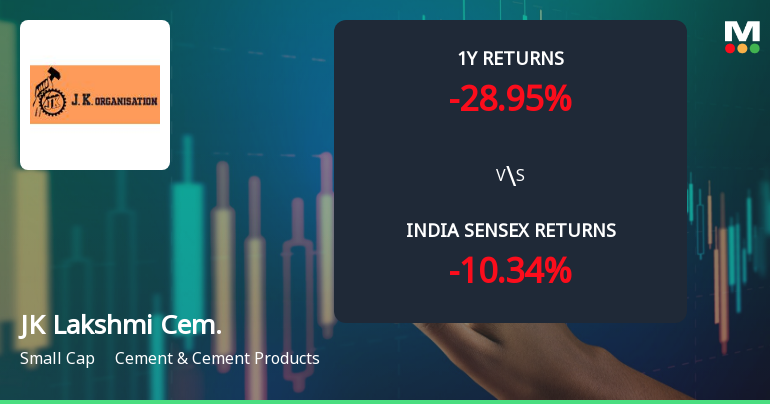
Consistent Underperformance against the benchmark over the last 3 years
Stock DNA
Cement & Cement Products
INR 7,362 Cr (Small Cap)
17.00
32
1.04%
0.35
10.98%
1.89
Total Returns (Price + Dividend) 
Latest dividend: 6.5 per share ex-dividend date: Jun-12-2025
Risk Adjusted Returns v/s
Returns Beta

News
JK Lakshmi Cement Ltd Technical Momentum Shifts Amid Bearish Trends
JK Lakshmi Cement Ltd has experienced a notable shift in its technical momentum, with key indicators signalling a transition from mildly bearish to bearish trends. Despite a modest day decline of 0.35%, the stock’s technical parameters reveal a complex interplay of bullish and bearish signals across weekly and monthly timeframes, warranting close attention from investors and market analysts alike.
Read full news article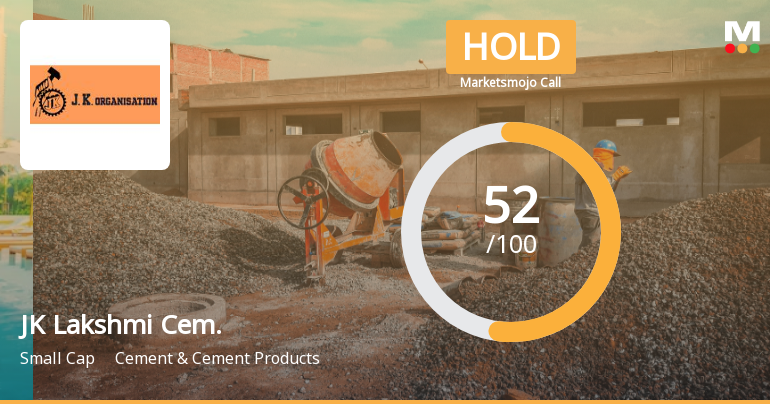
JK Lakshmi Cement Ltd Upgraded to Hold on Technical Improvement and Valuation Appeal
JK Lakshmi Cement Ltd has seen its investment rating upgraded from Sell to Hold as of 8 June 2026, reflecting a nuanced improvement in technical indicators and valuation metrics despite ongoing challenges in financial growth and market performance. The cement company’s Mojo Score now stands at 52.0, signalling a cautious but more optimistic stance among analysts.
Read full news article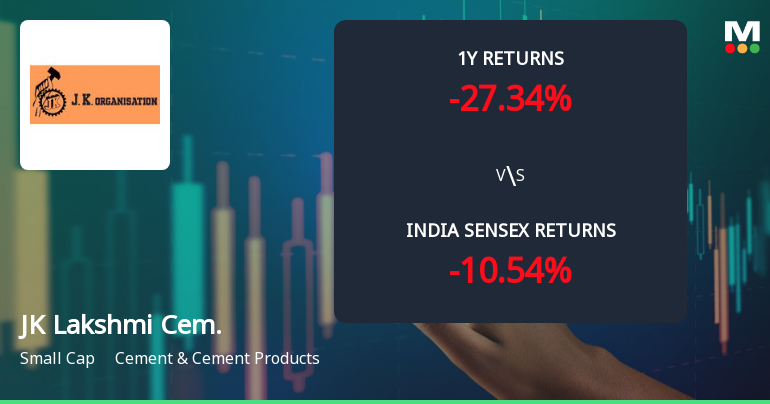
JK Lakshmi Cement Ltd Technical Momentum Shifts Amid Mixed Market Signals
JK Lakshmi Cement Ltd has experienced a notable shift in its technical parameters, reflecting a complex interplay of bullish and bearish signals. While the stock’s momentum shows signs of mild improvement on weekly indicators, monthly trends remain subdued, prompting a cautious stance among investors despite a recent upgrade in its Mojo Grade from Sell to Hold.
Read full news article Announcements
Announcement under Regulation 30 (LODR)-Acquisition
04-Jun-2026 | Source : BSEDisclosure under Regulation 30 of SEBI (Listing Obligations and Disclosure Requirements) Regulations 2015
Announcement under Regulation 30 (LODR)-Acquisition
04-Jun-2026 | Source : BSEDisclosure under Regulation 30 of SEBI (Listing Obligations and Disclosure Requirements) Regulations 2015
Compliances-Reg.24(A)-Annual Secretarial Compliance
27-May-2026 | Source : BSEAnnual Secretarial Compliance Report for the Financial Year ended 31st March 2026
Corporate Actions

No Upcoming Board Meetings

JK Lakshmi Cement Ltd has declared 130% dividend, ex-date: 12 Jun 25

JK Lakshmi Cement Ltd has announced 5:10 stock split, ex-date: 17 Dec 09

No Bonus history available

No Rights history available
Quality key factors
Valuation key factors
Technicals key factors
 Technical Indicator Scale: Bearish, Mildly Bearish, Sideways, Mildly Bullish, Bullish Turned
 Shareholding Snapshot : Mar 2026
Shareholding Compare (%holding)
Promoters
None
Held by 19 Schemes (18.31%)
Held by 118 FIIs (11.96%)
Bengal & Assam Company Ltd (42.04%)
Hdfc Mutual Fund - Hdfc Bse 500 Etf (4.34%)
15.66%
Quarterly Results Snapshot (Consolidated) - Mar'26 - QoQ

QoQ Growth in quarter ended Mar 2026 is 19.71% vs 3.70% in Dec 2025
QoQ Growth in quarter ended Mar 2026 is 117.96% vs -29.64% in Dec 2025
Half Yearly Results Snapshot (Consolidated) - Sep'25
Growth in half year ended Sep 2025 is 16.96% vs -15.33% in Sep 2024
Growth in half year ended Sep 2025 is 781.61% vs -84.69% in Sep 2024
Nine Monthly Results Snapshot (Consolidated) - Dec'25
YoY Growth in nine months ended Dec 2025 is 13.18% vs -14.23% in Dec 2024
YoY Growth in nine months ended Dec 2025 is 184.74% vs -67.87% in Dec 2024
Annual Results Snapshot (Consolidated) - Mar'26
YoY Growth in year ended Mar 2026 is 9.20% vs -8.78% in Mar 2025
YoY Growth in year ended Mar 2026 is 48.85% vs -41.33% in Mar 2025
About JK Lakshmi Cement Ltd

Company Coordinates


