
Compare JK Tyre & Indust with Similar Stocks
Stock DNA
Tyres & Rubber Products
INR 11,820 Cr (Small Cap)
13.00
21
0.69%
0.75
14.71%
1.96
Total Returns (Price + Dividend) 
Latest dividend: 3 per share ex-dividend date: Jul-31-2025
Risk Adjusted Returns v/s
Returns Beta

News
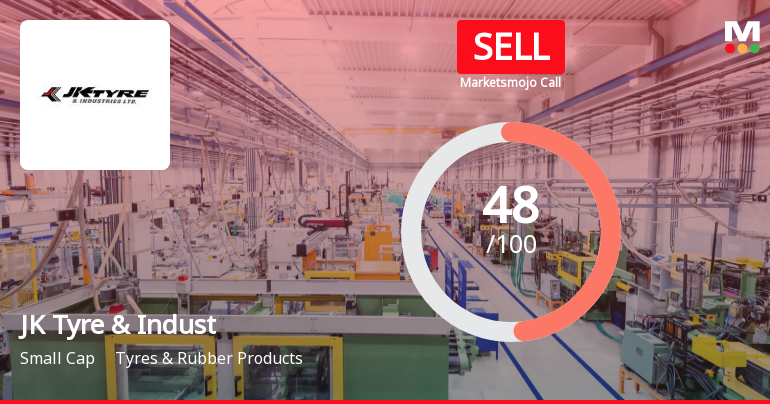
JK Tyre & Industries Ltd is Rated Sell
JK Tyre & Industries Ltd is rated Sell by MarketsMOJO, with this rating last updated on 26 May 2026. However, the analysis and financial metrics discussed here reflect the stock's current position as of 19 June 2026, providing investors with an up-to-date view of the company’s fundamentals, valuation, financial trends, and technical outlook.
Read full news article
JK Tyre & Industries Ltd Technical Momentum Shifts Amid Mixed Market Signals
JK Tyre & Industries Ltd (Stock ID: 700089) has experienced a nuanced shift in its technical momentum, reflecting a complex interplay of bearish and mildly bullish signals across key indicators. Despite a recent upgrade from a Hold to a Sell rating by MarketsMOJO on 25 May 2026, the stock’s price action and technical parameters suggest cautious optimism tempered by underlying weakness in the tyre and rubber products sector.
Read full news article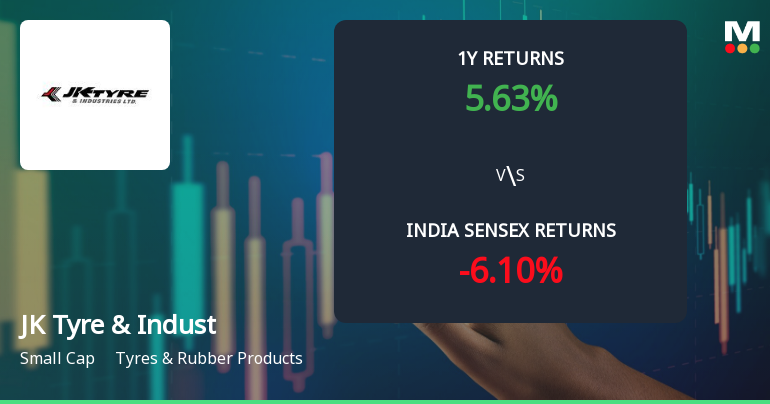
JK Tyre & Industries Ltd Faces Bearish Momentum Amid Technical Downgrade
JK Tyre & Industries Ltd has experienced a notable shift in its technical momentum, with key indicators signalling a transition from mildly bearish to bearish trends. Despite a strong long-term return profile, recent technical parameters suggest caution for investors as the stock faces downward pressure amid mixed signals from momentum oscillators and moving averages.
Read full news article Announcements
Announcement under Regulation 30 (LODR)-Credit Rating
12-Jun-2026 | Source : BSEDisclosure under Regulation 30 of the SEBI (Listing Obligations and Disclosure Requirements) Regulations 2015 - Credit Ratings.
Announcement under Regulation 30 (LODR)-Newspaper Publication
11-Jun-2026 | Source : BSESubmission of Notice to Shareholders in respect of Equity Shares proposed to be transferred to Demat Account of Investor Education and Protection Fund Authority.
Disclosure Under Regulation 30 Of The SEBI (Listing Obligations And Disclosure Requirements) Regulations 2015
11-Jun-2026 | Source : BSEDisclosure under Regulation 30 of the SEBI (Listing Obligations and Disclosure Requirements) Regulations 2015.
Corporate Actions

No Upcoming Board Meetings

JK Tyre & Industries Ltd has declared 150% dividend, ex-date: 31 Jul 25

JK Tyre & Industries Ltd has announced 2:10 stock split, ex-date: 18 Dec 14

No Bonus history available

JK Tyre & Industries Ltd has announced 1:3 rights issue, ex-date: 07 Jul 08
Quality key factors
Valuation key factors
Technicals key factors
 Technical Indicator Scale: Bearish, Mildly Bearish, Sideways, Mildly Bullish, Bullish Turned
 Shareholding Snapshot : Mar 2026
Shareholding Compare (%holding)
Promoters
None
Held by 23 Schemes (7.0%)
Held by 176 FIIs (18.6%)
Bengal & Assam Company Ltd. (45.43%)
Hdfc Mutual Fund - Hdfc Multi Cap Fund & Hdfc Hybrid Equity Fund & Hdfc Transportation And Logistics (5.45%)
14.68%
Quarterly Results Snapshot (Consolidated) - Mar'26 - QoQ

QoQ Growth in quarter ended Mar 2026 is 0.01% vs 5.28% in Dec 2025
QoQ Growth in quarter ended Mar 2026 is -14.32% vs -8.44% in Dec 2025
Half Yearly Results Snapshot (Consolidated) - Sep'25

Growth in half year ended Sep 2025 is 8.53% vs -4.66% in Sep 2024
Growth in half year ended Sep 2025 is 11.62% vs -12.50% in Sep 2024
Nine Monthly Results Snapshot (Consolidated) - Dec'25
YoY Growth in nine months ended Dec 2025 is 10.69% vs -3.26% in Dec 2024
YoY Growth in nine months ended Dec 2025 is 48.97% vs -35.31% in Dec 2024
Annual Results Snapshot (Consolidated) - Mar'26
YoY Growth in year ended Mar 2026 is 11.12% vs -2.06% in Mar 2025
YoY Growth in year ended Mar 2026 is 52.34% vs -35.21% in Mar 2025
About JK Tyre & Industries Ltd

Company Coordinates


