
Compare CEAT with Similar Stocks
Dashboard
Healthy long term growth as Net Sales has grown by an annual rate of 15.55% and Operating profit at 15.97%
With a growth in Net Profit of 58.16%, the company declared Very Positive results in Mar 26
With ROCE of 16.3, it has a Attractive valuation with a 2.1 Enterprise value to Capital Employed
High Institutional Holdings at 37.44%
Stock DNA
Tyres & Rubber Products
INR 13,959 Cr (Small Cap)
19.00
21
0.86%
0.64
14.81%
2.81
Total Returns (Price + Dividend) 
Latest dividend: 30 per share ex-dividend date: Aug-08-2025
Risk Adjusted Returns v/s
Returns Beta

News

CEAT Ltd is Rated Hold by MarketsMOJO
CEAT Ltd is rated 'Hold' by MarketsMOJO, with this rating last updated on 29 April 2026. However, the analysis and financial metrics discussed here reflect the stock's current position as of 24 June 2026, providing investors with the latest insights into the company’s performance and outlook.
Read full news article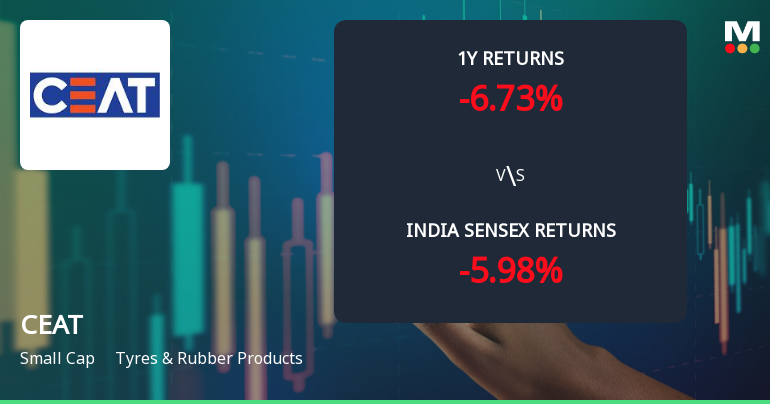
CEAT Ltd Technical Momentum Shifts Amid Mixed Market Signals
CEAT Ltd has exhibited a notable shift in its technical momentum, moving from a bearish stance to a mildly bearish outlook, reflecting a nuanced change in market sentiment. Despite a 3.64% gain on 16 Jun 2026, the tyre and rubber products company faces a complex technical landscape with mixed signals from key indicators such as MACD, RSI, Bollinger Bands, and moving averages.
Read full news article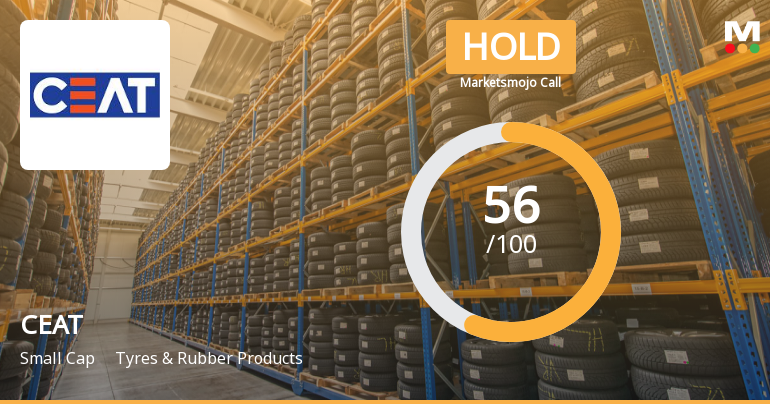
CEAT Ltd is Rated Hold by MarketsMOJO
CEAT Ltd is rated 'Hold' by MarketsMOJO, with this rating last updated on 29 April 2026. However, the analysis and financial metrics discussed here reflect the stock’s current position as of 13 June 2026, providing investors with the latest insights into the company’s performance and outlook.
Read full news article Announcements
CEAT Limited Has Informed The Exchange About Issue Of Duplicate Share Certificates
19-Jun-2026 | Source : BSECEAT Limited has informed the Exchange about Issue of Duplicate Share Certificates
CEAT Limited Has Informed The Exchange About Issue Of Duplicate Share Certificates
19-Jun-2026 | Source : BSECEAT Limited has informed the Exchange about Issue of Duplicate Share Certificates
Newspaper Publication
09-Jun-2026 | Source : BSENewspaper Publication
Corporate Actions

No Upcoming Board Meetings

CEAT Ltd has declared 300% dividend, ex-date: 08 Aug 25

No Splits history available

No Bonus history available

No Rights history available
Quality key factors
Valuation key factors
Technicals key factors
 Technical Indicator Scale: Bearish, Mildly Bearish, Sideways, Mildly Bullish, Bullish Turned
 Shareholding Snapshot : Mar 2026
Shareholding Compare (%holding)
Promoters
None
Held by 30 Schemes (17.65%)
Held by 205 FIIs (16.55%)
Instant Holdings Limited (29.51%)
Mirae Asset Nifty Total Market Index Fund (9.94%)
12.23%
Quarterly Results Snapshot (Consolidated) - Mar'26 - QoQ

QoQ Growth in quarter ended Mar 2026 is 1.49% vs 10.19% in Dec 2025

QoQ Growth in quarter ended Mar 2026 is 56.54% vs -16.23% in Dec 2025
Half Yearly Results Snapshot (Consolidated) - Sep'25
Growth in half year ended Sep 2025 is 12.39% vs 8.50% in Sep 2024
Growth in half year ended Sep 2025 is 8.10% vs -21.72% in Sep 2024
Nine Monthly Results Snapshot (Consolidated) - Dec'25
YoY Growth in nine months ended Dec 2025 is 16.96% vs 9.45% in Dec 2024
YoY Growth in nine months ended Dec 2025 is 21.71% vs -30.13% in Dec 2024
Annual Results Snapshot (Consolidated) - Mar'26
YoY Growth in year ended Mar 2026 is 18.61% vs 10.67% in Mar 2025
YoY Growth in year ended Mar 2026 is 47.69% vs -26.45% in Mar 2025
About CEAT Ltd

Company Coordinates


