
Compare John Cockerill with Similar Stocks
Dashboard
Company has a Debt to Equity ratio (avg) of 0 times
Poor long term growth as Net Sales has grown by an annual rate of % over the last 5 years
With a growth in Net Profit of 1569.05%, the company declared Very Positive results in Mar 26
Risky - Negative EBITDA
Despite the size of the company, domestic mutual funds hold only 0% of the company
Market Beating performance in long term as well as near term
Stock DNA
Industrial Manufacturing
INR 4,502 Cr (Small Cap)
159.00
39
0.08%
0.00
0.00%
0.00
Total Returns (Price + Dividend) 
Latest dividend: 6.999999999999999 per share ex-dividend date: Mar-06-2026
Risk Adjusted Returns v/s
Returns Beta

News

John Cockerill India Ltd is Rated Hold
John Cockerill India Ltd is rated 'Hold' by MarketsMOJO, with this rating last updated on 11 May 2026. While the rating was set on that date, the analysis and financial metrics discussed here reflect the company’s current position as of 17 July 2026, providing investors with an up-to-date view of the stock’s fundamentals, returns, and overall outlook.
Read full news article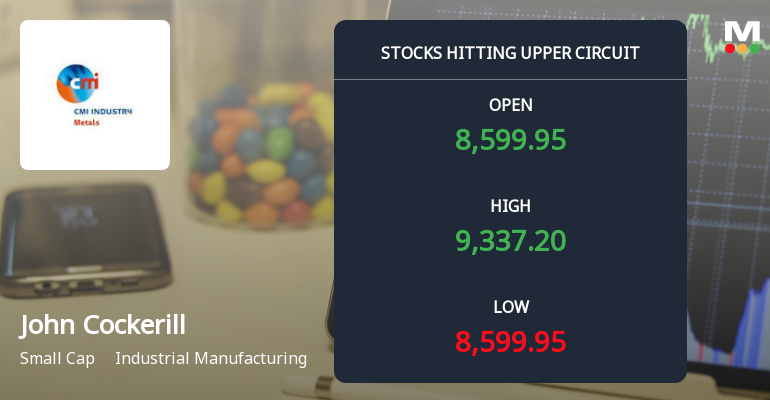
John Cockerill India Ltd Locks at Upper Circuit With 10% Gain — Buyers Queue, Sellers Absent
At Rs 9,342.5, the buying was done — not because demand dried up, but because the exchange wouldn't let the stock go any higher. John Cockerill India Ltd locked at its upper circuit of 10% on 9 Jul 2026, with buyers queuing and no sellers willing to part with shares, signalling unfilled demand at the ceiling price.
Read full news article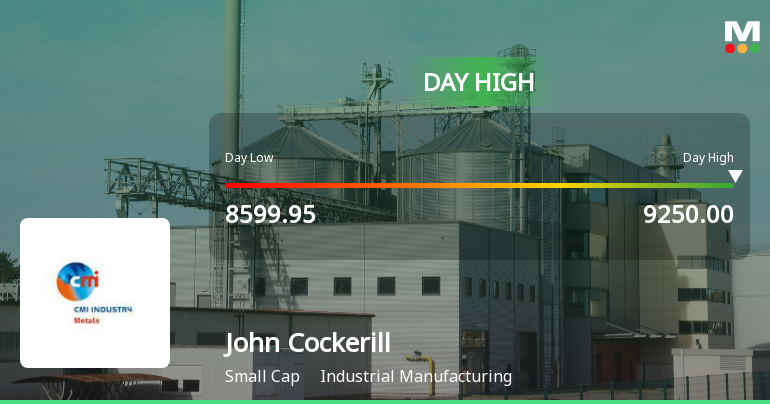
John Cockerill India Ltd Surges 8.38% to Day's High of Rs 9220 — Outperforms Sector by 6.82 Percentage Points
The Sensex advanced 0.62% on 09 Jul 2026, yet John Cockerill India Ltd outpaced the broader market with an 8.38% gain, touching an intraday high of Rs 9220. This 6.82-percentage-point outperformance over its Industrial Manufacturing sector signals a distinctly stock-specific rally rather than a market-wide lift.
Read full news article Announcements
Disclosure Of Reasons For Delay In Submission Of Un-Audited Financial Results (Standalone & Consolidated) For The Quarter Ended 31St March 2026.
16-Jul-2026 | Source : BSEPlease find attached disclosure with respect to reason for delay in submission of Un-audited Financial Result (Standalone & Consolidated) for the quarter ended 31st March 2026.
Compliances-Certificate under Reg. 74 (5) of SEBI (DP) Regulations 2018
13-Jul-2026 | Source : BSEPursuant to Regulation 74(5) of SEBI (Depositories and Participants) Regulations 2018 please find enclosed herewith a certificate for the quarter ended June 30 2026 issued by Bigshare Services Private Limited Registrar and Transfer Agent of the Company. The certificate confirms that the securities received from the Depositories Participants for dematerialization were confirmed to the Depositories. Kindly take the same on record and acknowledge the receipt.
Closure of Trading Window
27-Jun-2026 | Source : BSEIntimation for Closure of trading window for quarter and half year ended June 30 2026.
Corporate Actions

No Upcoming Board Meetings

John Cockerill India Ltd has declared 70% dividend, ex-date: 06 Mar 26

No Splits history available

No Bonus history available

No Rights history available
Quality key factors
Valuation key factors
Technicals key factors
 Technical Indicator Scale: Bearish, Mildly Bearish, Sideways, Mildly Bullish, Bullish Turned
 Shareholding Snapshot : Jun 2026
Shareholding Compare (%holding)
Promoters
None
Held by 0 Schemes
Held by 7 FIIs (0.32%)
John Cockerill Sa (formerly Cockerill Maintenance And Ingenierie Sa) (70.33%)
Datta Mahendra Shah (1.56%)
23.14%
Quarterly Results Snapshot (Standalone) - Mar'26 - QoQ

QoQ Growth in quarter ended Mar 2026 is 95.98% vs 5.25% in Dec 2025
QoQ Growth in quarter ended Mar 2026 is 1,569.05% vs -95.29% in Dec 2025
Half Yearly Results Snapshot (Standalone) - Jun'25
Not Applicable: The company has declared_date for only one period
Not Applicable: The company has declared_date for only one period
Nine Monthly Results Snapshot (Standalone) - Sep'25
YoY Growth in nine months ended Sep 2025 is -19.24% vs -52.54% in Sep 2024
YoY Growth in nine months ended Sep 2025 is 352.94% vs -118.07% in Sep 2024
Annual Results Snapshot (Standalone) - Dec'25
Not Applicable: The company has declared_date for only one period
Not Applicable: The company has declared_date for only one period
About John Cockerill India Ltd

Company Coordinates


