
 Price Point
Compare JP Power Ven. with Similar Stocks
ScoreDashboard
Poor Management Efficiency with a low ROCE of 7.29%
- The company has been able to generate a Return on Capital Employed (avg) of 7.29% signifying low profitability per unit of total capital (equity and debt)
Poor long term growth as Operating profit has grown by an annual rate 3.84% of over the last 5 years
The company has declared positive results in Jun'2026 after 2 consecutive negative quarters
With ROCE of 6.3, it has a Attractive valuation with a 1 Enterprise value to Capital Employed
79.2% of Promoter Shares are Pledged
Underperformed the market in the last 1 year


 Total Returns
Total Returns (Price + Dividend) 
Latest dividend: 0.0700 per share ex-dividend date: Aug-10-2009
Risk Adjusted Returns v/s
Returns Beta
 News & Corporate Actions
News
Are Jaiprakash Power Ventures Ltd latest results good or bad?
Jaiprakash Power Ventures Ltd's latest financial results for Q1 FY27 present a complex picture of operational strength alongside underlying vulnerabilities. The company reported a net profit of ₹468.84 crore, a significant turnaround from a loss in the previous quarter, driven by a remarkable increase in net sales to ₹1,775.70 crore, reflecting a quarter-on-quarter growth of 28.08% and a year-on-year increase of 12.16%. This revenue growth marks the highest quarterly figure in the company's recent history. The operating margin, excluding other income, reached 42.74%, the highest in eight quarters, indicating improved operational efficiency and capacity utilization. However, this performance was notably influenced by a negative tax charge of ₹92.04 crore, which contributed to the net profit, suggesting that the underlying profitability may not be as robust without such exceptional items. Additionally, the c...
Read full news article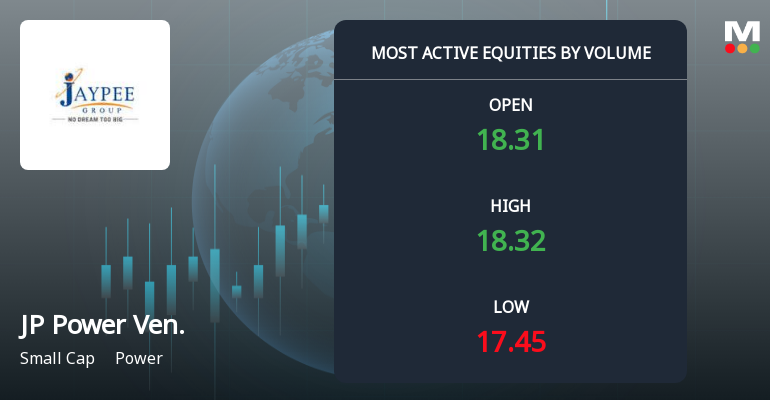
Jaiprakash Power Ventures Ltd Sees Exceptional Volume Surge Amid Positive Momentum
Jaiprakash Power Ventures Ltd (JPPOWER) has emerged as one of the most actively traded stocks in the power sector, registering a remarkable surge in trading volume and price performance. The stock’s recent upward momentum, coupled with strong investor participation, signals a potential shift in market sentiment for this small-cap power company.
Read full news article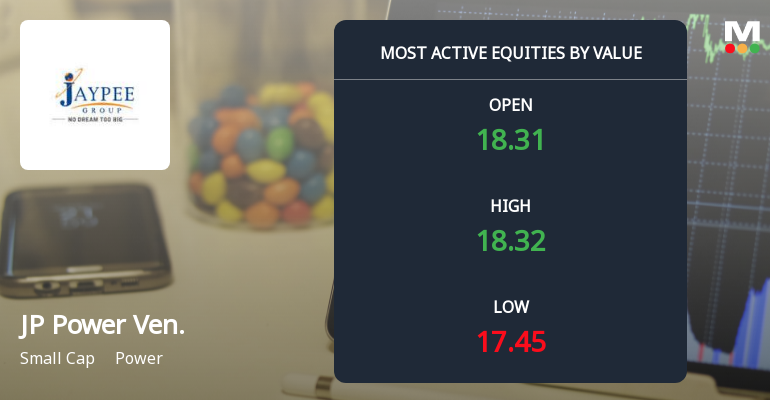
Jaiprakash Power Ventures Ltd Sees Surge in Value Trading and Institutional Interest
Jaiprakash Power Ventures Ltd (JPPOWER), a small-cap player in the power sector, has emerged as one of the most actively traded stocks by value on 21 July 2026, reflecting heightened investor interest and robust trading volumes. The stock’s recent performance, coupled with improved institutional participation and technical indicators, signals a potential shift in market sentiment towards this power company.
Read full news article Announcements
Revised Disclosures under Reg. 31(1) and 31(2) of SEBI (SAST) Regulations 2011.
14-Jul-2026 | Source : BSEThe Exchange has received revised Disclosure under Regulation 31(1) and 31(2) of SEBI (Substantial Acquisition of Shares & Takeovers) Regulations 2011 on July 13 2026 for Adani Power Ltd
Revised Disclosures of reasons for encumbrance by promoter of listed companies under Reg. 31(1) read with Regulation 28(3) of SEBI (SAST) Regulations 2011.
14-Jul-2026 | Source : BSEThe Exchange has received the revised Disclosures of reasons for encumbrance by promoter of listed companies under Reg. 31(1) read with Regulation 28(3) of SEBI (SAST) Regulations 2011 on July 13 2026 for Adani Power Ltd
Board Meeting Intimation for To Consider And Approve Inter-Alia The Un-Audited Standalone And Consolidated Financial Results Of The Company For The Quarter Ended 30Th June 2026.
13-Jul-2026 | Source : BSEJaiprakash Power Ventures Ltdhas informed BSE that the meeting of the Board of Directors of the Company is scheduled on 20/07/2026 inter alia to consider and approve To consider and approve inter-alia the Un-audited Standalone and Consolidated Financial Results of the Company for the Quarter ended 30th June 2026.
Corporate Actions

No Upcoming Board Meetings

Jaiprakash Power Ventures Ltd has declared 8% dividend, ex-date: 10 Aug 09

No Splits history available

No Bonus history available

No Rights history available
Key FactorsQuality key factors
Valuation key factors
Technicals key factors
 Technical Indicator Scale: Bearish, Mildly Bearish, Sideways, Mildly Bullish, Bullish Turned Shareholding
Shareholding Snapshot : Jun 2026
Shareholding Compare (%holding)
Non Institution
79.1995
Held by 18 Schemes (0.48%)
Held by 98 FIIs (6.76%)
Adani Power Limited (24.0%)
Naresh Chander Talwar (5.02%)
44.52%
FinancialQuarterly Results Snapshot (Consolidated) - Jun'26 - QoQ
 Compare with Peers
QoQ Growth in quarter ended Jun 2026 is 28.08% vs 19.98% in Mar 2026
QoQ Growth in quarter ended Jun 2026 is 3,606.66% vs -454.64% in Mar 2026

Half Yearly Results Snapshot (Consolidated) - Sep'25
Growth in half year ended Sep 2025 is 1.35% vs -2.50% in Sep 2024

Growth in half year ended Sep 2025 is -13.36% vs 104.06% in Sep 2024
Nine Monthly Results Snapshot (Consolidated) - Dec'25
YoY Growth in nine months ended Dec 2025 is 1.35% vs -21.47% in Dec 2024
YoY Growth in nine months ended Dec 2025 is -29.47% vs 51.88% in Dec 2024
Annual Results Snapshot (Consolidated) - Mar'26
YoY Growth in year ended Mar 2026 is 1.85% vs -19.23% in Mar 2025
YoY Growth in year ended Mar 2026 is -44.61% vs -20.39% in Mar 2025
 Company CV
About Jaiprakash Power Ventures Ltd

Company Coordinates










