
Compare JSW Holdings with Similar Stocks
Stock DNA
Holding Company
INR 13,076 Cr (Small Cap)
91.00
9
0.00%
0.00
0.45%
0.41
Total Returns (Price + Dividend) 
JSW Holdings for the last several years.
Risk Adjusted Returns v/s
Returns Beta

News
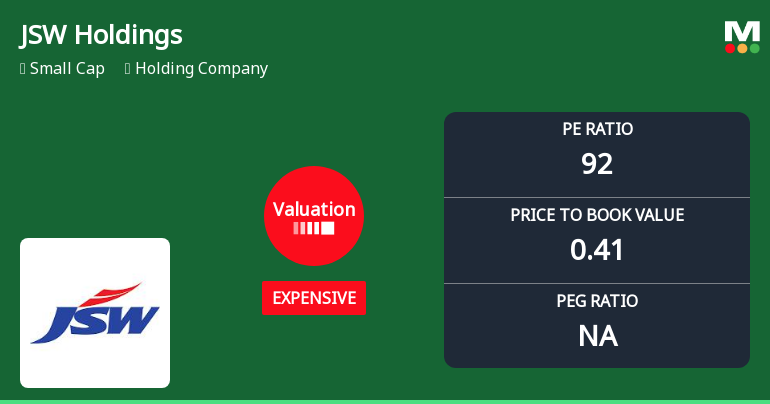
JSW Holdings Ltd Valuation Shifts Signal Price Attractiveness Concerns
JSW Holdings Ltd has witnessed a marked shift in its valuation parameters, moving from a fair to an expensive rating as its price-to-earnings (P/E) ratio surged to 92.24. This significant re-rating, coupled with a price-to-book value (P/BV) of 0.41 and elevated enterprise value multiples, signals a notable change in price attractiveness compared to historical and peer benchmarks.
Read full news article
JSW Holdings Ltd is Rated Sell
JSW Holdings Ltd is rated 'Sell' by MarketsMOJO, with this rating last updated on 29 May 2026. However, the analysis and financial metrics discussed here reflect the stock’s current position as of 30 June 2026, providing investors with the latest insights into the company’s performance and outlook.
Read full news article
JSW Holdings Ltd is Rated Sell
JSW Holdings Ltd is rated 'Sell' by MarketsMOJO, with this rating last updated on 29 May 2026. However, the analysis and financial metrics discussed here reflect the stock's current position as of 19 June 2026, providing investors with the most up-to-date view of the company’s fundamentals, returns, and technical outlook.
Read full news article Announcements
JSW Holdings Limited - Updates
18-Nov-2019 | Source : NSEJSW Holdings Limited has informed the Exchange regarding 'Postal Ballot Updates'.
JSW Holdings Limited - Updates
29-Oct-2019 | Source : NSEJSW Holdings Limited has informed the Exchange that the Company has fixed Cut off Date as November 8, 2019 for the purpose to conduct Postal Ballot for seeking approval of Shareholders for a material related party transaction.
JSW Holdings Limited - Updates
18-Oct-2019 | Source : NSEJSW Holdings Limited has informed the Exchange regarding 'Board Meeting Updates
Corporate Actions

No Upcoming Board Meetings

No Dividend history available

No Splits history available

No Bonus history available

No Rights history available
Quality key factors
Valuation key factors
Technicals key factors
 Technical Indicator Scale: Bearish, Mildly Bearish, Sideways, Mildly Bullish, Bullish Turned
 Shareholding Snapshot : Mar 2026
Shareholding Compare (%holding)
Promoters
None
Held by 14 Schemes (0.06%)
Held by 98 FIIs (22.65%)
Siddeshwari Tradex Private Limited (11.34%)
None
6.29%
Quarterly Results Snapshot (Consolidated) - Mar'26 - QoQ

QoQ Growth in quarter ended Mar 2026 is 1.47% vs -60.92% in Dec 2025

QoQ Growth in quarter ended Mar 2026 is -57.85% vs -52.18% in Dec 2025
Half Yearly Results Snapshot (Consolidated) - Sep'25
Growth in half year ended Sep 2025 is -40.00% vs 64.30% in Sep 2024
Growth in half year ended Sep 2025 is -41.37% vs 96.69% in Sep 2024
Nine Monthly Results Snapshot (Consolidated) - Dec'25
YoY Growth in nine months ended Dec 2025 is -33.08% vs 53.35% in Dec 2024
YoY Growth in nine months ended Dec 2025 is -28.48% vs 52.21% in Dec 2024
Annual Results Snapshot (Consolidated) - Mar'26
YoY Growth in year ended Mar 2026 is -27.67% vs 46.31% in Mar 2025
YoY Growth in year ended Mar 2026 is -25.11% vs 25.89% in Mar 2025
About JSW Holdings Ltd

Company Coordinates


