
Compare JTL Industries with Similar Stocks
Stock DNA
Iron & Steel Products
INR 3,043 Cr (Small Cap)
30.00
26
0.15%
0.13
6.62%
2.09
Total Returns (Price + Dividend) 
Latest dividend: 0.12 per share ex-dividend date: Sep-12-2025
Risk Adjusted Returns v/s
Returns Beta

News
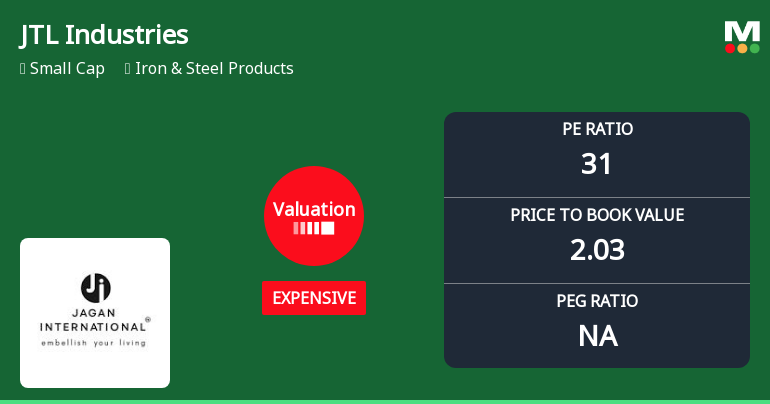
JTL Industries Ltd Valuation Shifts Signal Changing Market Sentiment
JTL Industries Ltd, a small-cap player in the Iron & Steel Products sector, has seen a notable shift in its valuation metrics, moving from fair to expensive territory. Despite this, the stock has delivered robust returns year-to-date, outperforming the Sensex by a wide margin. This article analyses the recent valuation changes, compares them with peer averages, and assesses the implications for investors.
Read full news article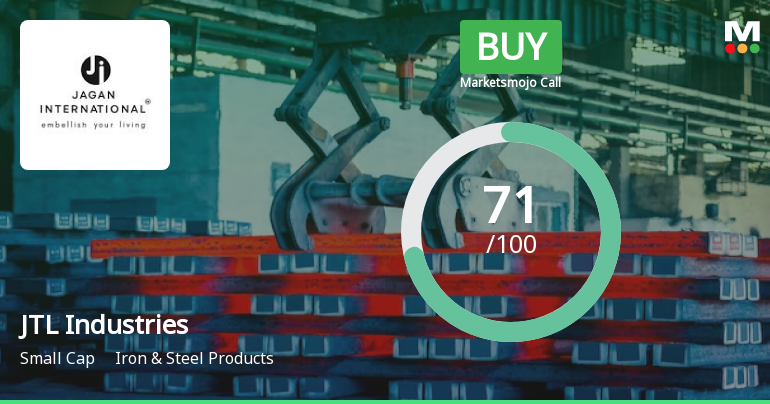
JTL Industries Ltd is Rated Buy
JTL Industries Ltd is rated Buy by MarketsMOJO, with this rating last updated on 04 June 2026. However, the analysis and financial metrics discussed here reflect the stock's current position as of 21 June 2026, providing investors with the most up-to-date insight into the company’s performance and outlook.
Read full news article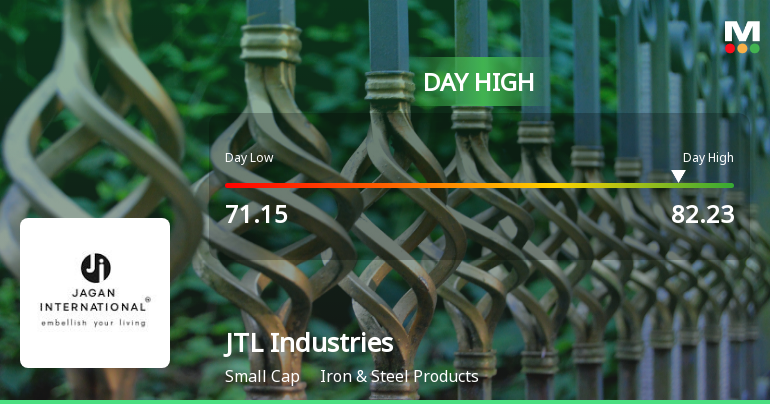
JTL Industries Ltd Surges 8.24% to Day's High of Rs 81.75 — Outperforms Sector by 7.67 Percentage Points
While the Sensex declined 0.84% on 19 Jun 2026, JTL Industries Ltd surged 8.24%, outperforming its Iron & Steel Products sector by 7.67 percentage points. This sharp single-session gain stands out amid a broadly weak market, signalling a stock-specific momentum shift rather than a general market rally.
Read full news article Announcements
Announcement under Regulation 30 (LODR)-Award_of_Order_Receipt_of_Order
10-Jun-2026 | Source : BSEReceipt of Order from Himachal Pradesh State Civil Supplies Corporation Limited
Announcement under Regulation 30 (LODR)-Press Release / Media Release
10-Jun-2026 | Source : BSEReceipt of order from Himachal Pradesh State Civil Supplies Corporation Limited
Compliances-Reg.24(A)-Annual Secretarial Compliance
19-May-2026 | Source : BSEAnnual Secretarial Compliance Report for Financial Year ended 31.03.2026
Corporate Actions

No Upcoming Board Meetings

JTL Industries Ltd has declared 12% dividend, ex-date: 12 Sep 25

JTL Industries Ltd has announced 1:2 stock split, ex-date: 14 Nov 24

JTL Industries Ltd has announced 1:1 bonus issue, ex-date: 07 Sep 23

No Rights history available
Quality key factors
Valuation key factors
Technicals key factors
 Technical Indicator Scale: Bearish, Mildly Bearish, Sideways, Mildly Bullish, Bullish Turned
 Shareholding Snapshot : Mar 2026
Shareholding Compare (%holding)
Promoters
5.313
Held by 1 Schemes (0.0%)
Held by 21 FIIs (3.4%)
Nikita Singla (13.35%)
Zenith Multi Trading Dmcc (2.81%)
31.77%
Quarterly Results Snapshot (Consolidated) - Mar'26 - YoY

YoY Growth in quarter ended Mar 2026 is 47.55% vs 0.73% in Mar 2025
YoY Growth in quarter ended Mar 2026 is 104.58% vs -43.08% in Mar 2025
Half Yearly Results Snapshot (Consolidated) - Sep'25

Growth in half year ended Sep 2025 is -2.19% vs -1.19% in Sep 2024
Growth in half year ended Sep 2025 is -33.86% vs 7.09% in Sep 2024
Nine Monthly Results Snapshot (Consolidated) - Dec'25
YoY Growth in nine months ended Dec 2025 is -0.20% vs -8.12% in Dec 2024
YoY Growth in nine months ended Dec 2025 is -21.88% vs -1.75% in Dec 2024
Annual Results Snapshot (Consolidated) - Mar'26
YoY Growth in year ended Mar 2026 is 11.48% vs -6.10% in Mar 2025
YoY Growth in year ended Mar 2026 is -0.35% vs -12.56% in Mar 2025
About JTL Industries Ltd

Company Coordinates


