
Compare Kairosoft AI with Similar Stocks
Stock DNA
Auto Components & Equipments
INR 9 Cr (Micro Cap)
NA (Loss Making)
21
0.00%
0.00
-1.10%
0.24
Total Returns (Price + Dividend) 
Kairosoft AI for the last several years.
Risk Adjusted Returns v/s
Returns Beta

News
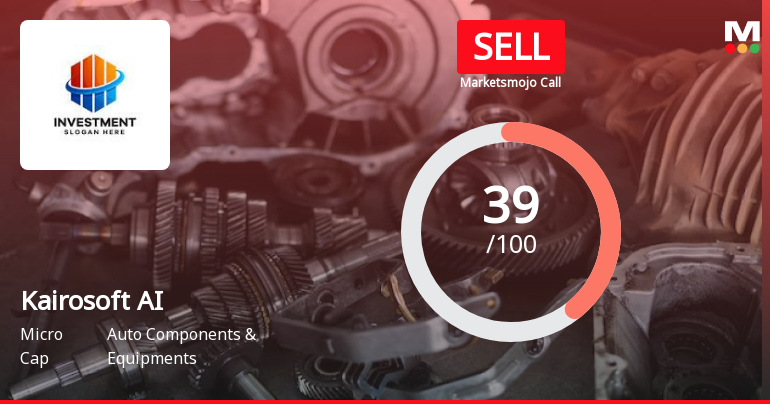
Kairosoft AI Solutions Ltd Upgraded to Sell: A Detailed Analysis of the Rating Change
Kairosoft AI Solutions Ltd, a micro-cap player in the Auto Components & Equipments sector, has seen its investment rating upgraded from Strong Sell to Sell as of 5 June 2026. This change reflects a nuanced shift in the company’s technical outlook amid persistent fundamental challenges, prompting a reassessment of its risk and opportunity profile by market analysts.
Read full news articleAre Kairosoft AI Solutions Ltd latest results good or bad?
Kairosoft AI Solutions Ltd's latest financial results for Q4 FY26 reveal a significant operational downturn. The company reported net sales of ₹0.00 crores, marking a complete cessation of revenue generation compared to ₹1.27 crores in the previous quarter. This dramatic decline indicates a fundamental breakdown in business operations, raising concerns about the company's viability in the auto components sector. The net profit for the quarter was a loss of ₹0.14 crores, a stark contrast to the profit of ₹0.75 crores recorded in Q3 FY26. This shift underscores the fragility of Kairosoft AI's business model, as it faced an operating loss of ₹0.46 crores before accounting for other income. The reliance on ₹0.38 crores of other income to mitigate losses highlights the unsustainable nature of its current operations. Additionally, the company's return on equity (ROE) stands at a low 0.64%, indicating minimal re...
Read full news article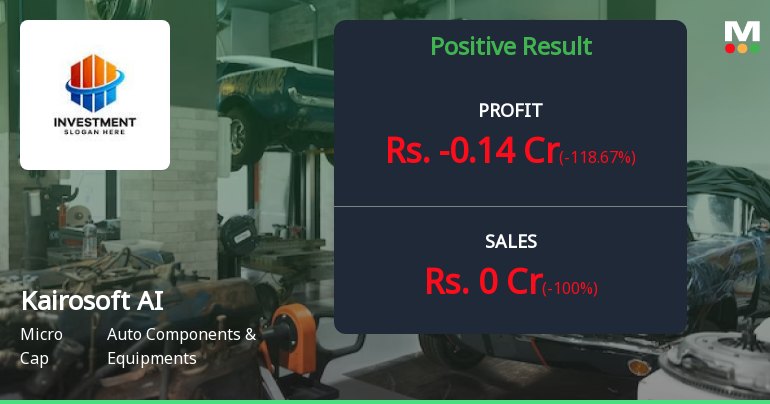
Kairosoft AI Solutions Q4 FY26: Losses Mount as Revenue Vanishes
Kairosoft AI Solutions Ltd. (formerly Pankaj Piyush Trade & Investment Ltd.) reported deeply troubling results for Q4 FY26, with net sales evaporating entirely to ₹0.00 crores and the company slipping into a quarterly loss of ₹0.14 crores. The micro-cap auto components company, with a market capitalisation of just ₹8.00 crores, saw its shares tumble 4.40% to ₹66.77 on May 29, 2026, as investors reacted to the complete collapse of revenue generation. The quarter marked a dramatic reversal from Q3 FY26's profitable performance, raising serious questions about business sustainability and operational viability.
Read full news article Announcements
Disclosures under Reg. 29(2) of SEBI (SAST) Regulations 2011
22-Jun-2026 | Source : BSEThe Exchange has received the disclosure under Regulation 29(2) of SEBI (Substantial Acquisition of Shares & Takeovers) Regulations 2011 for Sanjeev Lunkad & PACs
Disclosures under Reg. 29(2) of SEBI (SAST) Regulations 2011
10-Jun-2026 | Source : BSEThe Exchange has received the disclosure under Regulation 29(2) of SEBI (Substantial Acquisition of Shares & Takeovers) Regulations 2011 for Kreon Financial Services Ltd
Disclosures under Reg. 29(1) of SEBI (SAST) Regulations 2011
06-Jun-2026 | Source : BSEThe Exchange has received the disclosure under Regulation 29(1) of SEBI (Substantial Acquisition of Shares & Takeovers) Regulations 2011 for Kreon Finnancial Services Ltd
Corporate Actions

No Upcoming Board Meetings

No Dividend history available

No Splits history available

No Bonus history available

Kairosoft AI Solutions Ltd has announced 2:1 rights issue, ex-date: 11 Feb 25
Quality key factors
Valuation key factors
Technicals key factors
 Technical Indicator Scale: Bearish, Mildly Bearish, Sideways, Mildly Bullish, Bullish Turned
 Shareholding Snapshot : Mar 2026
Shareholding Compare (%holding)
Non Institution
None
Held by 0 Schemes
Held by 0 FIIs
Vinod Kumar Bansal (5.07%)
Smita Khurana (5.22%)
74.59%
Quarterly Results Snapshot (Standalone) - Mar'26 - QoQ

QoQ Growth in quarter ended Mar 2026 is -100.00% vs 3.25% in Dec 2025
QoQ Growth in quarter ended Mar 2026 is -118.67% vs 7.14% in Dec 2025
Half Yearly Results Snapshot (Standalone) - Sep'25

Growth in half year ended Sep 2025 is 0.00% vs -100.00% in Sep 2024
Growth in half year ended Sep 2025 is -285.71% vs 16.67% in Sep 2024
Nine Monthly Results Snapshot (Standalone) - Dec'25
YoY Growth in nine months ended Dec 2025 is 0.00% vs -100.00% in Dec 2024
YoY Growth in nine months ended Dec 2025 is -120.71% vs 191.67% in Dec 2024
Annual Results Snapshot (Standalone) - Mar'26
YoY Growth in year ended Mar 2026 is 0.00% vs 0.00% in Mar 2025
YoY Growth in year ended Mar 2026 is 82.01% vs 47.47% in Mar 2025
About Kairosoft AI Solutions Ltd

Company Coordinates


