
Compare Kalind with Similar Stocks
Dashboard
Weak Long Term Fundamental Strength with an average Return on Equity (ROE) of 5.94%
With a growth in Net Profit of 509.76%, the company declared Very Positive results in Mar 26
With ROE of 15.1, it has a Expensive valuation with a 4.9 Price to Book Value
Consistent Returns over the last 3 years
Stock DNA
Non Banking Financial Company (NBFC)
INR 1,000 Cr (Micro Cap)
32.00
21
0.03%
0.05
15.12%
4.88
Total Returns (Price + Dividend) 
Latest dividend: 0.0047575722999999995 per share ex-dividend date: Aug-14-2025
Risk Adjusted Returns v/s
Returns Beta

News
Kalind Ltd is Rated Hold
Kalind Ltd is rated 'Hold' by MarketsMOJO, with this rating last updated on 13 July 2026. However, the analysis and financial metrics discussed here reflect the stock's current position as of 25 July 2026, providing investors with an up-to-date view of its fundamentals, returns, and market standing.
Read full news article
Kalind Ltd Upgraded to Hold by MarketsMOJO on Valuation and Financial Performance
Kalind Ltd, a micro-cap player in the Non Banking Financial Company (NBFC) sector, has seen its investment rating upgraded from Sell to Hold as of 13 July 2026. This change reflects a nuanced improvement across valuation metrics, financial trends, and technical indicators, despite some lingering concerns over long-term fundamentals. The company’s recent stellar quarterly results and strong stock performance have been key drivers behind this reassessment.
Read full news article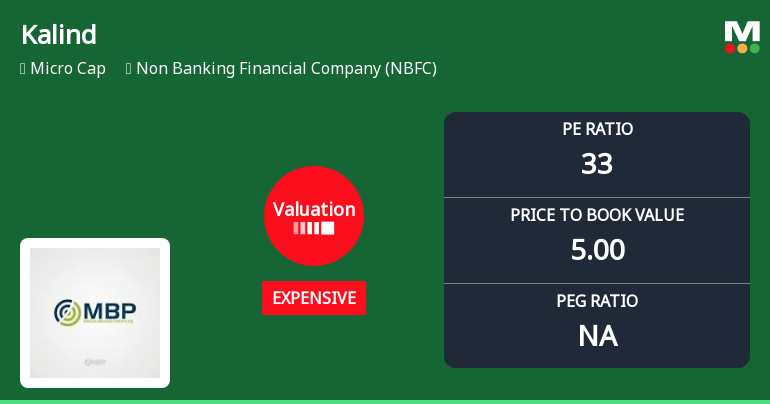
Kalind Ltd Valuation Shifts Signal Price Attractiveness Change Amid NBFC Sector Dynamics
Kalind Ltd, a micro-cap player in the Non Banking Financial Company (NBFC) sector, has experienced a notable shift in its valuation parameters, moving from a 'very expensive' to an 'expensive' rating. This change reflects evolving market perceptions and has implications for price attractiveness, especially when analysed against historical trends and peer benchmarks within the NBFC space.
Read full news article Announcements
Execution Of Framework Teaming And Conditional Subcontracting Agreement
25-Jul-2026 | Source : BSEExecution of Framework Teaming and Conditional Subcontracting Agreement with Dharan International Limited United Kingdom.
Board Meeting Outcome for Outcome Of The Board Meeting Dated 22.07.2026
22-Jul-2026 | Source : BSEOutcome of the Board Meeting dated 22.07.2026
Board Meeting Intimation for To Consider And Approve Fund Rising
17-Jul-2026 | Source : BSEKalind Ltdhas informed BSE that the meeting of the Board of Directors of the Company is scheduled on 22/07/2026 inter alia to consider and approve fund rising through any permissible mode as the Board may deem appropriate.
Corporate Actions

No Upcoming Board Meetings

Kalind Ltd has declared 10% dividend, ex-date: 14 Aug 25

Kalind Ltd has announced 2:10 stock split, ex-date: 24 Jul 26

Kalind Ltd has announced 1:2 bonus issue, ex-date: 24 Jul 26

Kalind Ltd has announced 139:100 rights issue, ex-date: 30 Jan 26
Quality key factors
Valuation key factors
Technicals key factors
 Technical Indicator Scale: Bearish, Mildly Bearish, Sideways, Mildly Bullish, Bullish Turned
 Shareholding Snapshot : Jun 2026
Shareholding Compare (%holding)
Non Institution
None
Held by 0 Schemes
Held by 0 FIIs
Jasani Dharmendra Bhai Becharbhai (13.2%)
Satani Chhaganbhai Ratilalbhai (2.81%)
66.95%
Quarterly Results Snapshot (Consolidated) - Mar'26 - QoQ

QoQ Growth in quarter ended Mar 2026 is 119.42% vs -16.03% in Dec 2025
QoQ Growth in quarter ended Mar 2026 is 509.76% vs -73.35% in Dec 2025
Half Yearly Results Snapshot (Consolidated) - Sep'25
Growth in half year ended Sep 2025 is 0.00% vs -100.00% in Sep 2024
Growth in half year ended Sep 2025 is 8,664.71% vs -342.86% in Sep 2024
Nine Monthly Results Snapshot (Consolidated) - Dec'25
YoY Growth in nine months ended Dec 2025 is 0.00% vs -100.00% in Dec 2024
YoY Growth in nine months ended Dec 2025 is 4,700.00% vs -248.00% in Dec 2024
Annual Results Snapshot (Consolidated) - Mar'26
YoY Growth in year ended Mar 2026 is 0.00% vs -100.00% in Mar 2025
YoY Growth in year ended Mar 2026 is 18,253.33% vs -138.46% in Mar 2025
About Kalind Ltd

Company Coordinates


