
Compare Kalyani Forge with Similar Stocks
Dashboard
Company's ability to service its debt is weak with a poor EBIT to Interest (avg) ratio of 1.74
- Poor long term growth as Net Sales has grown by an annual rate of 5.35% over the last 5 years
- Company's ability to service its debt is weak with a poor EBIT to Interest (avg) ratio of 1.74
- The company has been able to generate a Return on Equity (avg) of 6.92% signifying low profitability per unit of shareholders funds
Healthy long term growth as Operating profit has grown by an annual rate 82.26%
The company has declared positive results in Mar'2026 after 2 consecutive negative quarters
With ROCE of 9.3, it has a Attractive valuation with a 1.6 Enterprise value to Capital Employed
Stock DNA
Castings & Forgings
INR 219 Cr (Micro Cap)
24.00
47
0.66%
1.08
9.76%
2.32
Total Returns (Price + Dividend) 
Latest dividend: 4 per share ex-dividend date: Aug-22-2025
Risk Adjusted Returns v/s
Returns Beta

News
Kalyani Forge Ltd Upgraded to Hold on Improved Valuation and Financial Trends
Kalyani Forge Ltd has seen its investment rating upgraded from Sell to Hold, driven primarily by a significant improvement in its valuation metrics alongside positive financial trends and technical indicators. The company’s mojo score has risen to 51.0, reflecting a more balanced outlook amid a micro-cap classification in the Castings & Forgings sector.
Read full news article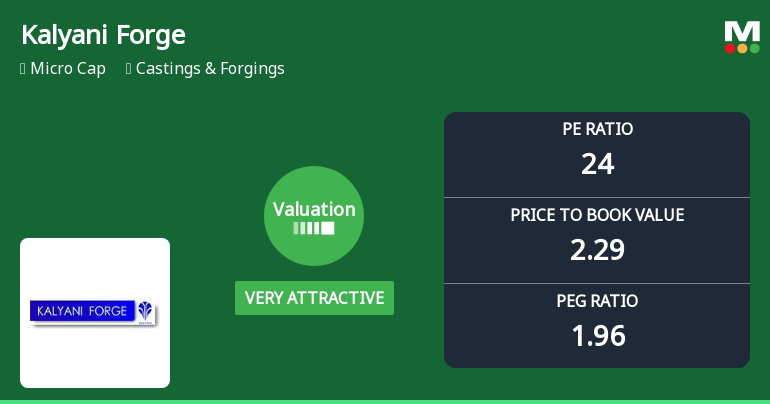
Kalyani Forge Ltd Valuation Shifts Signal Renewed Price Attractiveness
Kalyani Forge Ltd has witnessed a notable shift in its valuation parameters, moving from an 'attractive' to a 'very attractive' rating, reflecting improved price appeal relative to its historical averages and peer group. This re-rating comes amid a backdrop of mixed returns and evolving market dynamics within the Castings & Forgings sector.
Read full news article
Kalyani Forge Ltd is Rated Sell by MarketsMOJO
Kalyani Forge Ltd is rated 'Sell' by MarketsMOJO, with this rating last updated on 03 June 2026. However, the analysis and financial metrics discussed here reflect the company’s current position as of 15 June 2026, providing investors with an up-to-date view of the stock’s fundamentals, returns, and technical outlook.
Read full news article Announcements
Announcement under Regulation 30 (LODR)-Resignation of Chief Financial Officer (CFO)
11-Jun-2026 | Source : BSEKalyani Forge Limited has informed the Exchange about the resignation of Mr. Jagdish Baheti as Chief Financial Officer of the Company.
Compliances-Reg.24(A)-Annual Secretarial Compliance
09-Jun-2026 | Source : BSEKalyani Forge Limited has intimated the Exchange about the Annual Secretarial Compliance Report.
Announcement under Regulation 30 (LODR)-Earnings Call Transcript
09-Jun-2026 | Source : BSEKalyani Forge Limited has informed the Exchange about the Transcript.
Corporate Actions

No Upcoming Board Meetings

Kalyani Forge Ltd has declared 40% dividend, ex-date: 22 Aug 25

No Splits history available

No Bonus history available

No Rights history available
Quality key factors
Valuation key factors
Technicals key factors
 Technical Indicator Scale: Bearish, Mildly Bearish, Sideways, Mildly Bullish, Bullish Turned
 Shareholding Snapshot : Mar 2026
Shareholding Compare (%holding)
Promoters
None
Held by 0 Schemes
Held by 0 FIIs
Kalyani Consultants Pvt.ltd. (10.37%)
Bf Investment Limited (15.66%)
19.09%
Quarterly Results Snapshot (Standalone) - Mar'26 - YoY

YoY Growth in quarter ended Mar 2026 is -3.34% vs 3.75% in Mar 2025
YoY Growth in quarter ended Mar 2026 is 163.68% vs 214.08% in Mar 2025
Half Yearly Results Snapshot (Standalone) - Sep'25

Growth in half year ended Sep 2025 is 0.62% vs -0.99% in Sep 2024
Growth in half year ended Sep 2025 is -16.63% vs 83.26% in Sep 2024
Nine Monthly Results Snapshot (Standalone) - Dec'25
YoY Growth in nine months ended Dec 2025 is -0.01% vs -1.26% in Dec 2024
YoY Growth in nine months ended Dec 2025 is -43.51% vs 58.59% in Dec 2024
Annual Results Snapshot (Standalone) - Mar'26
YoY Growth in year ended Mar 2026 is -0.85% vs -0.06% in Mar 2025
YoY Growth in year ended Mar 2026 is 12.15% vs 82.64% in Mar 2025
About Kalyani Forge Ltd

Company Coordinates


