
Compare Kalyani Invest. with Similar Stocks
Stock DNA
Non Banking Financial Company (NBFC)
INR 2,230 Cr (Small Cap)
52.00
22
0.00%
0.00
0.50%
0.25
Total Returns (Price + Dividend) 
Kalyani Invest. for the last several years.
Risk Adjusted Returns v/s
Returns Beta

News
Kalyani Investment Company Ltd Upgraded to Sell on Technical Improvements Despite Weak Financials
Kalyani Investment Company Ltd has seen its investment rating upgraded from Strong Sell to Sell as of 7 May 2026, driven primarily by a shift in technical indicators despite ongoing challenges in financial performance and valuation metrics. This nuanced change reflects a complex interplay of quality, valuation, financial trends, and technical signals that investors should carefully consider.
Read full news article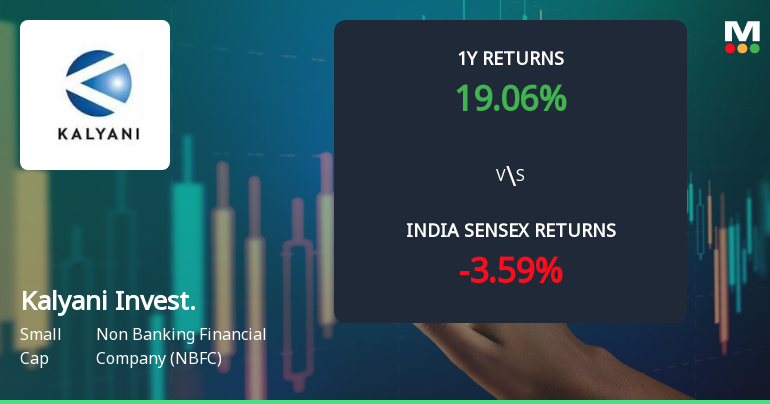
Kalyani Investment Company Ltd Shows Technical Momentum Shift Amid Mixed Indicators
Kalyani Investment Company Ltd, a small-cap player in the Non Banking Financial Company (NBFC) sector, has exhibited a notable shift in its technical momentum, moving from a mildly bearish to a mildly bullish trend on weekly charts. Despite mixed signals across various technical indicators, the stock’s recent price action and relative strength against the Sensex suggest a cautiously optimistic outlook for investors.
Read full news article
Kalyani Investment Company Ltd is Rated Strong Sell
Kalyani Investment Company Ltd is rated Strong Sell by MarketsMOJO, with this rating last updated on 09 Feb 2026. However, the analysis and financial metrics discussed below reflect the stock’s current position as of 28 April 2026, providing investors with an up-to-date view of the company’s fundamentals, valuation, financial trends, and technical outlook.
Read full news article Announcements
Announcement Under Regulation 30 (LODR)-Newspaper Publication
16-Apr-2026 | Source : BSEAnnouncement U/R 30 of SEBI LODR-Newspaper Publication-Reminder 1 regarding Opening of Special Window for Re-lodgement of Transfer Requests of Physical Shares
Format of the Initial Disclosure to be made by an entity identified as a Large Corporate : Annexure A
15-Apr-2026 | Source : BSEFormat of Initial Disclosure to be made by an entity identified as a Large Corporate.
| Sr. No. | Particulars | Details |
| 1 | Name of Company | Kalyani Investment Company Ltd |
| 2 | CIN NO. | L65993PN2009PLC134196 |
| 3 | Outstanding borrowing of company as on 31st March / 31st December as applicable (in Rs cr) | 0.00 |
| 4 | Highest Credit Rating during the previous FY | NA |
| 4a | Name of the Credit Rating Agency issuing the Credit Rating mentioned in (4) | Not Applicable |
| 5 | Name of Stock Exchange# in which the fine shall be paid in case of shortfall in the required borrowing under the framework | BSE |
Designation: Company Secretary and Compliance Officer
EmailId: nihal.gupta@kalyani-investment.com
Designation: CHIEF EXECUTIVE OFFICER AND CHIEF FINANCIAL OFFICER
EmailId: anurag.jain@kalyani-investment.com
Date: 15/04/2026
Note: In terms para of 3.2(ii) of the circular beginning F.Y 2022 in the event of shortfall in the mandatory borrowing through debt securities a fine of 0.2% of the shortfall shall be levied by Stock Exchanges at the end of the two-year block period. Therefore an entity identified as LC shall provide in its initial disclosure for a financial year the name of Stock Exchange to which it would pay the fine in case of shortfall in the mandatory borrowing through debt markets.
Compliances-Certificate under Reg. 74 (5) of SEBI (DP) Regulations 2018
07-Apr-2026 | Source : BSECertificate under Regulation 74(5) of the SEBI (Depositories and Participants) Regulations 2018 for the quarter from January 1 2026 to March 31 2026
Corporate Actions

No Upcoming Board Meetings

No Dividend history available

No Splits history available

No Bonus history available

No Rights history available
Quality key factors
Valuation key factors
Technicals key factors
 Technical Indicator Scale: Bearish, Mildly Bearish, Sideways, Mildly Bullish, Bullish Turned
 Shareholding Snapshot : Mar 2026
Shareholding Compare (%holding)
Promoters
None
Held by 5 Schemes (0.0%)
Held by 7 FIIs (0.65%)
Sundaram Trading & Investment Private Limited (60.94%)
Oleander Investment Pvt Ltd (1.08%)
18.63%
Quarterly Results Snapshot (Consolidated) - Dec'25 - QoQ

QoQ Growth in quarter ended Dec 2025 is -85.11% vs 660.03% in Sep 2025
QoQ Growth in quarter ended Dec 2025 is -90.97% vs 695.28% in Sep 2025
Half Yearly Results Snapshot (Consolidated) - Sep'25
Growth in half year ended Sep 2025 is -2.83% vs 21.35% in Sep 2024
Growth in half year ended Sep 2025 is -63.06% vs 22.53% in Sep 2024
Nine Monthly Results Snapshot (Consolidated) - Dec'25
YoY Growth in nine months ended Dec 2025 is -0.93% vs 22.06% in Dec 2024
YoY Growth in nine months ended Dec 2025 is -61.94% vs 12.21% in Dec 2024
Annual Results Snapshot (Consolidated) - Mar'25
YoY Growth in year ended Mar 2025 is 17.08% vs 20.08% in Mar 2024
YoY Growth in year ended Mar 2025 is 2.13% vs 20.61% in Mar 2024
About Kalyani Investment Company Ltd

Company Coordinates


