
 Price Point
Compare Kamat Hotels with Similar Stocks
ScoreDashboard
Flat results in Mar 26
- PAT(9M) At Rs 30.77 cr has Grown at -32.76%
- INTEREST(Q) Highest at Rs 9.86 cr
- NON-OPERATING INCOME(Q) is 37.79 % of Profit Before Tax (PBT)
Despite the size of the company, domestic mutual funds hold only 0.01% of the company
Underperformed the market in the last 1 year
Mojo ParametersStock DNA

Hotels & Resorts

INR 512 Cr (Micro Cap)

15.00
56

0.00%

0.58

10.82%

1.61
Total ReturnsTotal Returns (Price + Dividend) 
Latest dividend: 0.6700 per share ex-dividend date: Sep-11-2009
Risk Adjusted Returns v/s
Returns Beta
 News & Corporate Actions
News
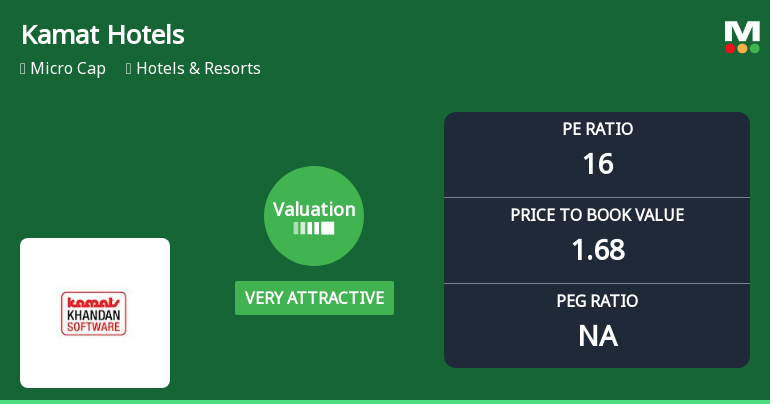
Kamat Hotels Valuation Shifts to Very Attractive Amid Mixed Market Performance
Kamat Hotels (India) Ltd has witnessed a notable shift in its valuation parameters, moving from an attractive to a very attractive rating, despite a recent downgrade in its overall Mojo Grade to Sell. This change is underpinned by improved price-to-earnings and price-to-book value ratios, positioning the micro-cap hotel and resort company as a compelling value proposition relative to its peers and historical benchmarks.
Read full news article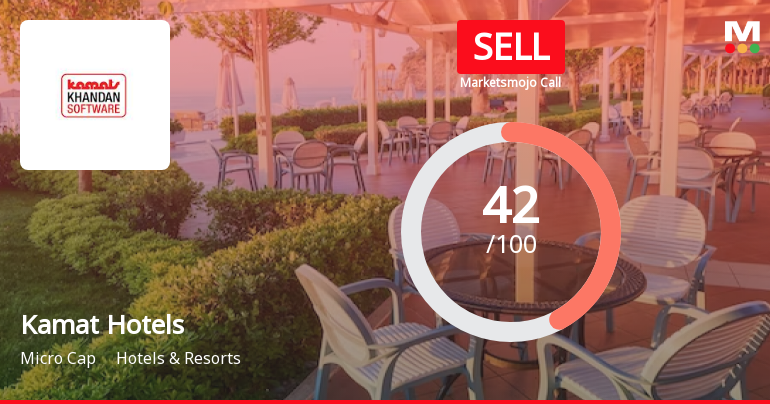
Kamat Hotels (India) Ltd is Rated Sell
Kamat Hotels (India) Ltd is rated 'Sell' by MarketsMOJO, with this rating last updated on 04 May 2026. However, the analysis and financial metrics discussed here reflect the stock's current position as of 13 July 2026, providing investors with an up-to-date view of the company’s fundamentals, returns, and market standing.
Read full news article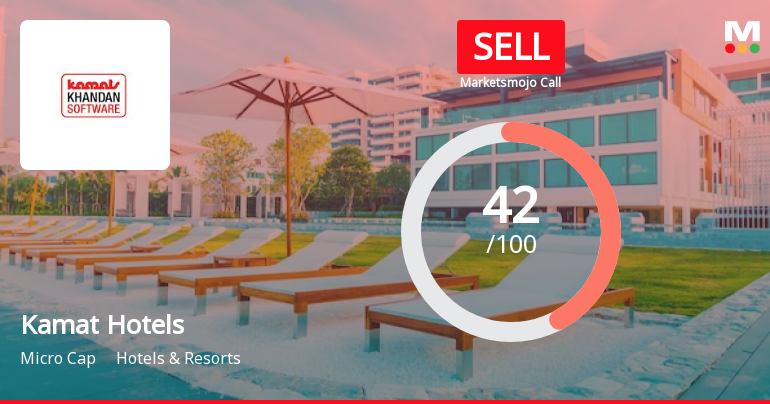
Kamat Hotels (India) Ltd is Rated Sell
Kamat Hotels (India) Ltd is rated 'Sell' by MarketsMOJO, with this rating last updated on 04 May 2026. However, the analysis and financial metrics discussed below reflect the stock's current position as of 02 July 2026, providing investors with an up-to-date view of the company’s fundamentals, returns, and market standing.
Read full news article Announcements
Kamat Hotels (I) Limited - Other General Purpose
13-Nov-2019 | Source : NSEKamat Hotels (I) Limited has informed the Exchange regarding Disclosure under Regulation 23(9) of SEBI (Listing Obligations and Disclosure Requirements) Regulations, 2015, (SEBI LODR) - Details of Related Party Transactions.
Kamat Hotels (I) Limited - Trading Window
04-Nov-2019 | Source : NSEKamat Hotels (I) Limited has informed the Exchange regarding the Trading Window closure pursuant to SEBI (Prohibition of Insider Trading) Regulations, 2015
Kamat Hotels (I) Limited - Disclosure under SEBI Takeover Regulations
09-Oct-2019 | Source : NSEKamat Hotels (I) Limited has informed the Exchange regarding reason for encumbrance vide letter dated October 04, 2019 under SEBI ( SAST) Regulations, 2011.
Corporate Actions

No Upcoming Board Meetings

Kamat Hotels (India) Ltd has declared 12% dividend, ex-date: 11 Sep 09

No Splits history available

No Bonus history available

No Rights history available
Key FactorsQuality key factors
Valuation key factors
Technicals key factors
 Technical Indicator Scale: Bearish, Mildly Bearish, Sideways, Mildly Bullish, Bullish Turned Shareholding
Shareholding Snapshot : Jun 2026
Shareholding Compare (%holding)
Promoters
None
Held by 1 Schemes (0.0%)
Held by 2 FIIs (0.02%)
Vishal Amusements Limited (18.25%)
Alpha Alternatives Structured Credit Opportunities Fund (3.33%)
27.36%
FinancialQuarterly Results Snapshot (Consolidated) - Mar'26 - YoY
 Compare with Peers
YoY Growth in quarter ended Mar 2026 is 19.20% vs 9.31% in Mar 2025

YoY Growth in quarter ended Mar 2026 is 49.14% vs 415.96% in Mar 2025

Half Yearly Results Snapshot (Consolidated) - Sep'25
Growth in half year ended Sep 2025 is -0.85% vs 19.09% in Sep 2024
Growth in half year ended Sep 2025 is -92.57% vs 719.13% in Sep 2024
Nine Monthly Results Snapshot (Consolidated) - Dec'25
YoY Growth in nine months ended Dec 2025 is 4.13% vs 20.41% in Dec 2024
YoY Growth in nine months ended Dec 2025 is -49.44% vs -16.67% in Dec 2024
Annual Results Snapshot (Consolidated) - Mar'26
YoY Growth in year ended Mar 2026 is 8.03% vs 17.29% in Mar 2025
YoY Growth in year ended Mar 2026 is -8.29% vs 3.86% in Mar 2025
 Company CV
About Kamat Hotels (India) Ltd

Company Coordinates










