Karnika Industri

  • Market Cap: Micro Cap
  • Industry: Garments & Apparels
  • ISIN: INE0MGA01012
  • NSEID: KARNIKA
  • BSEID:
INR
108.15
-0.85 (-0.78%)
BSENSE

Mar 27

BSE+NSE Vol: 291000

  • Price Points
  • Score
  • Mojo Parameters
  • Total Return
  • News and Corporate Actions
  • Key factors
  • Shareholding
  • Financials
  • CompanyCV
stock-summaryPrice Point
High/Low

1Day

52 Week

Valuation
Technical
Day's Volume

CASH

2.91 lacs (1,355.00%) Volume

Shareholding (Dec 2025)

FII

0.00%

Held by 0 FIIs

DII

0.00%

Held by 0 DIIs

Promoter

73.39%

When is the next results date for Karnika Industri?

06-Jun-2025

No Upcoming Board Meetings

Has Karnika Industri declared dividend?

06-Jun-2025

Karnika Industries Ltd has declared a 1% dividend, amounting to ₹0.10 per share, with an ex-date of March 28, 2025. While recent returns have been strong, there have been no returns over longer periods, indicating potential volatility.

Karnika Industries Ltd has declared a 1% dividend.<BR><BR>Dividend Details:<BR>- Percentage announced: 1%<BR>- Amount per share: 0.10<BR>- Ex-date: 28 Mar 25<BR><BR>Dividend Yield: 0.01%<BR><BR>Total Returns by Period:<BR>Over the last 6 months, the price return was 94.41%, the dividend return was 0.03%, resulting in a total return of 94.44%.<BR><BR>In the past year, the price return reached 161.06%, with a dividend return of 0.04%, leading to a total return of 161.1%.<BR><BR>Over the last 2 years, there was no price return or dividend return, resulting in a total return of 0.0%.<BR><BR>For the 3-year period, both price and dividend returns were 0%, leading to a total return of 0.0%.<BR><BR>In the 4-year period, there was again no price or dividend return, resulting in a total return of 0.0%.<BR><BR>Finally, over the last 5 years, there were no price or dividend returns, resulting in a total return of 0.0%.<BR><BR>The company has declared a modest dividend, and while recent returns over shorter periods are strong, the lack of returns over longer periods suggests potential volatility or challenges in sustaining growth.

View full answer

Who are the peers of the Karnika Industri?

04-Jun-2025

Karnika Industri's peers include Trent, Page Industries, K P R Mill Ltd, Vedant Fashions, Trident, RSWM Ltd, Rajapalayam Mill, R&B Denims, Foce India, and Le Merite Export. K P R Mill Ltd shows excellent growth and management risk, while Karnika Industri has average growth and a 1-year return of 0.00%.

Peers: The peers of Karnika Industri are Trent, Page Industries, K P R Mill Ltd, Vedant Fashions, Trident, RSWM Ltd, Rajapalayam Mill, R&B Denims, Foce India, Le Merite Export.<BR><BR>Quality Snapshot: Excellent management risk is observed at Page Industries, K P R Mill Ltd, and Vedant Fashions, while Good management risk is found at Trent. Average management risk is present at Trident, RSWM Ltd, R&B Denims, and Le Merite Export, and Below Average management risk is noted at Rajapalayam Mill. Growth is Excellent for K P R Mill Ltd, while Average growth is seen at Karnika Industri, Trent, and Foce India. Below Average growth is found at Page Industries, Vedant Fashions, Trident, RSWM Ltd, Rajapalayam Mill, and Le Merite Export, and the rest have Good growth.<BR><BR>Return Snapshot: K P R Mill Ltd has the highest 1-year return at 41.32%, while Vedant Fashions has the lowest at -24.57%. Karnika Industri's 1-year return is 0.00%, which is lower than K P R Mill Ltd and higher than Vedant Fashions. Additionally, Vedant Fashions, Trident, RSWM Ltd, Rajapalayam Mill, and Le Merite Export have negative six-month returns.

View full answer

What does Karnika Industri do?

17-Jul-2025

Karnika Industries Ltd, a Micro Cap company in the Garments & Apparels industry, was incorporated in 2022 and transitioned from a partnership formed in 2017. It currently reports no sales or profit data, with a market cap of INR 809 Cr and a P/E ratio of 47.00.

Overview:<BR>Karnika Industries Ltd operates in the Garments & Apparels industry and is classified as a Micro Cap company.<BR><BR>History:<BR>Karnika Industries Ltd was incorporated in 2022, having originally been formed as a Partnership Firm named "Karni International" in 2017. The firm transitioned to a Public Limited Company through a Certificate of Incorporation from the Registrar of Companies, Kolkata. There is no sales or profit data reported for the latest quarter.<BR><BR>Financial Snapshot:<BR>Most recent Net Sales: N/A<BR>Most recent Net Profit: N/A<BR>Market-cap value: INR 809 Cr (Micro Cap)<BR><BR>Key Metrics:<BR>P/E: 47.00<BR>Industry P/E: 23<BR>Dividend Yield: 0.02%<BR>Debt-Equity: 0.76<BR>Return on Equity: 33.95%<BR>Price-to-Book: 15.12<BR><BR>Contact Details:<BR>Registrar Address: Not available<BR>Phone: N/A<BR>Email: N/A<BR>Website: N/A

View full answer

Who are the top shareholders of the Karnika Industri?

17-Jul-2025

The top shareholders of Karnika Industri are primarily promoters, with Niranjan Mundhra holding 24.46%. Muskan Distributors Private Limited is the largest public shareholder at 1.1%, while individual investors own 13.14%, and there are no pledged promoter holdings or mutual fund investments.

The top shareholders of Karnika Industri include the promoters, who hold the majority of the shares. The promoter with the highest holding is Niranjan Mundhra, owning 24.46% of the company. Additionally, Muskan Distributors Private Limited is the highest public shareholder, holding 1.1%. Individual investors collectively hold 13.14% of the shares. There are no pledged promoter holdings, and the company has minimal foreign institutional investment, with only one FII holding 0.01%. Mutual funds do not hold any shares in Karnika Industri.

View full answer

How big is Karnika Industri?

24-Jul-2025

As of 24th July, Karnika Industries Ltd has a market capitalization of 823.00 Cr, classifying it as a Micro Cap company, with no valid financial data available for Net Sales and Net Profit for the latest four quarters. The balance sheet as of March 2024 shows Shareholder's Funds of 53.11 Cr and Total Assets of 119.74 Cr.

As of 24th July, <BR><BR>Market Cap: Karnika Industries Ltd has a market capitalization of 823.00 Cr, categorizing it as a Micro Cap company.<BR><BR>Recent Quarterly Performance: There is no valid financial data available for Net Sales and Net Profit for the latest four quarters.<BR><BR>Balance Sheet Snapshot: The reporting period is March 2024, with Shareholder's Funds amounting to 53.11 Cr and Total Assets valued at 119.74 Cr.

View full answer

What is the bonus history of Karnika Industri?

28-Aug-2025

Karnika Industries has a bonus history that includes a 4:1 bonus issue announced for August 29, 2025, meaning shareholders will receive 4 additional shares for every 1 share held on that date.

Karnika Industries has a recent bonus history that includes a 4:1 bonus issue announced with an ex-date of August 29, 2025. This means that for every 1 share held, shareholders will receive an additional 4 shares. The record date for this bonus is also August 29, 2025. If you have any more questions about the company or its financial activities, feel free to ask!

View full answer

How has been the historical performance of Karnika Industri?

15-Nov-2025

Karnika Industri has shown strong historical performance, with net sales increasing from INR 124.59 crore in March 2023 to INR 172.55 crore in March 2025, alongside significant growth in profits and total assets, indicating a strengthening financial position.

Answer:<BR>The historical performance of Karnika Industri shows a positive trend in key financial metrics over the past three years.<BR><BR>Breakdown:<BR>Karnika Industri's net sales increased significantly from INR 124.59 crore in March 2023 to INR 172.55 crore in March 2025. The total operating income followed a similar trend, rising from INR 124.59 crore in March 2023 to INR 172.55 crore in March 2025. The total expenditure, excluding depreciation, also grew from INR 109.41 crore in March 2023 to INR 146.51 crore in March 2025. Operating profit (PBDIT) saw a notable increase, reaching INR 29.77 crore in March 2025, up from INR 16.64 crore in March 2023. Profit before tax rose from INR 11.09 crore in March 2023 to INR 24.17 crore in March 2025, while profit after tax increased from INR 8.18 crore to INR 18.03 crore during the same period. The company's total assets grew from INR 97.81 crore in March 2023 to INR 154.47 crore in March 2025, and total liabilities increased from INR 97.81 crore to INR 154.47 crore. Cash flow from operating activities improved from a negative INR 10 crore in March 2023 to a positive INR 4 crore in March 2025, although the net cash outflow was INR 10 crore in March 2025. Overall, Karnika Industri has demonstrated growth in sales, profits, and asset base, indicating a strengthening financial position.

View full answer

Is Karnika Industri overvalued or undervalued?

18-Nov-2025

As of November 17, 2025, Karnika Industri is considered attractive and undervalued at a price of 147.55, with strong financial ratios including a PE ratio of 40.59, a competitive position compared to peers, and a year-to-date return of 96.73%, despite recent underperformance against the Sensex.

As of 17 November 2025, the valuation grade for Karnika Industri has moved from very expensive to attractive. This indicates a significant shift in perception regarding the company's value. Based on the analysis, Karnika Industri appears to be undervalued at its current price of 147.55, especially considering its robust financial ratios. The company has a PE ratio of 40.59, an EV to EBITDA of 30.37, and a PEG ratio of 0.33, which suggests strong growth potential relative to its price.<BR><BR>In comparison to its peers, Karnika Industri's valuation metrics are competitive. For instance, K P R Mill Ltd is categorized as very expensive with a PE ratio of 44.24, while Trident, which is also attractive, has a significantly lower PE of 32.69. Additionally, Karnika's return on equity (ROE) stands at an impressive 25.39%, further reinforcing its attractiveness in the garments and apparel industry. Notably, despite recent stock performance lagging behind the Sensex over the past month, the year-to-date return of 96.73% highlights the company's strong recovery and growth trajectory.

View full answer

Is Karnika Industri technically bullish or bearish?

02-Dec-2025

As of December 1, 2025, Karnika Industri's trend has shifted to mildly bullish, supported by daily moving averages, despite some caution from weekly MACD and KST indicators.

As of 1 December 2025, the technical trend for Karnika Industri has changed from sideways to mildly bullish. The current stance is mildly bullish, driven by the daily moving averages indicating a bullish trend. However, the weekly MACD and KST are mildly bearish, suggesting some caution. The weekly RSI remains bullish, which supports the positive outlook. Overall, while there are mixed signals from the weekly indicators, the shift to mildly bullish reflects a more optimistic short-term perspective.

View full answer

Why is Karnika Industries Ltd falling/rising?

18-Mar-2026

As of 17-Mar, Karnika Industries Ltd's stock price has risen to 115.00, up 3.51%, driven by positive market sentiment and increased investor participation. Despite a negative annual return of -10.88%, the company's strong profit growth and attractive valuation are contributing to a favorable short-term outlook.

As of 17-Mar, Karnika Industries Ltd is experiencing a rise in its stock price, currently at 115.00, with a change of 3.9 (3.51%) upward. This increase can be attributed to several factors. Firstly, the stock has outperformed its sector by 2.75% today, indicating positive market sentiment. Additionally, there has been a notable rise in investor participation, with a delivery volume of 34,000 on March 16, which is up by 34.92% compared to the 5-day average. This suggests increased interest from investors.<BR><BR>Moreover, the company has an attractive valuation, evidenced by a return on capital employed (ROCE) of 16.7 and a low enterprise value to capital employed ratio of 5.2. Despite the stock's negative performance over the past year, where it has generated a return of -10.88%, the company has seen a significant profit increase of 79%, which may contribute to a more favorable outlook among investors.<BR><BR>However, it is important to note that the stock has underperformed the broader market over the last year, and domestic mutual funds hold no stake in the company, which could indicate a lack of confidence among institutional investors. Despite these concerns, the current rise in stock price reflects a short-term positive sentiment, likely driven by increased trading activity and investor interest.

View full answer

Why is Karnika Industries Ltd falling/rising?

19-Mar-2026

As of 18-Mar, Karnika Industries Ltd's stock price is at 114.15, reflecting a decline of 0.74% and significant underperformance compared to the Sensex. The stock has dropped 20.04% over the past month, indicating bearish sentiment and reduced investor participation.

As of 18-Mar, Karnika Industries Ltd's stock price is falling, currently at 114.15, which reflects a decrease of 0.85 or 0.74%. The stock has underperformed compared to the benchmark Sensex, which has only declined by 0.37% over the same period. Over the past month, Karnika Industries has seen a significant drop of 20.04%, while the Sensex has decreased by 7.91%. Year-to-date, the stock is down 2.81%, contrasting with the Sensex's decline of 9.00%. <BR><BR>Additionally, the stock's performance today indicates a notable underperformance against its sector by 3.53%. The moving averages show that the stock is higher than its 5-day moving average but lower than the 20-day, 50-day, 100-day, and 200-day moving averages, suggesting a bearish trend. Furthermore, there has been a substantial decline in investor participation, with delivery volume dropping by 70.93% compared to the 5-day average. This lack of investor interest may contribute to the downward pressure on the stock price. Overall, these factors indicate a bearish sentiment surrounding Karnika Industries Ltd, leading to its current price decline.

View full answer

Why is Karnika Industries Ltd falling/rising?

20-Mar-2026

As of 19-Mar, Karnika Industries Ltd's stock price is Rs 108.45, down 4.99%, significantly underperforming the market with a one-week decline of 5.70% and a monthly drop of 26.15%. Despite a 79% profit increase over the past year, the stock has a negative return of 19.90%, indicating a disconnect between profitability and stock performance.

As of 19-Mar, Karnika Industries Ltd is experiencing a decline in its stock price, currently at Rs 108.45, which reflects a change of -5.7 (-4.99%). The stock has underperformed significantly compared to the broader market, with a one-week decline of -5.70% against the Sensex's -2.69%. Over the past month, the stock has dropped by -26.15%, while the Sensex has only decreased by -9.63%. Year-to-date, Karnika Industries has seen a decline of -7.66%, compared to the Sensex's -11.97%.<BR><BR>The stock is also close to its 52-week low, being only 2.21% away from Rs 106.05. Additionally, it is trading below its moving averages across various time frames, indicating a bearish trend. Although there has been a rise in investor participation, with a delivery volume increase of 72.13% on March 18, this has not translated into a positive price movement.<BR><BR>Financially, the company has shown a profit increase of 79% over the past year, yet the stock has generated a negative return of -19.90%, which suggests a disconnect between the company's profitability and its stock performance. Furthermore, the lack of investment from domestic mutual funds, which hold 0% of the company, may indicate a lack of confidence in the stock's valuation or business prospects. Overall, these factors contribute to the ongoing decline in the stock price of Karnika Industries Ltd.

View full answer

Why is Karnika Industries Ltd falling/rising?

21-Mar-2026

As of 20-Mar, Karnika Industries Ltd's stock price has risen to 113.85, up 4.98%, driven by strong investor interest and a significant increase in delivery volume. Despite a challenging year with a -15.03% return, the company's profits have surged by 79%, suggesting improved valuation prospects.

As of 20-Mar, Karnika Industries Ltd is experiencing a rise in its stock price, currently at 113.85, reflecting an increase of 5.4 or 4.98%. This upward movement can be attributed to several factors. Notably, the stock has outperformed its sector by 5.13% today, indicating strong relative performance. Additionally, there has been a significant increase in investor participation, with delivery volume rising by 169.23% against the 5-day average, suggesting heightened interest and confidence among investors.<BR><BR>Despite a challenging year where the stock has generated a return of -15.03%, it is important to note that the company's profits have increased by 79%, which may contribute to a more favorable perception of its valuation. The stock's attractive valuation is further supported by a return on capital employed (ROCE) of 16.7 and a low PEG ratio of 0.5, indicating potential for growth relative to its earnings.<BR><BR>However, it is essential to consider that the stock has underperformed the broader market over the past year, and domestic mutual funds hold no stake in the company, which could reflect a lack of confidence in its price or business prospects. Nonetheless, the current rise in stock price appears to be driven by positive investor sentiment and increased trading activity.

View full answer

Why is Karnika Industries Ltd falling/rising?

24-Mar-2026

As of 23-Mar, Karnika Industries Ltd's stock price is slightly rising at 114.00, but it has faced a significant decline of 14.85% over the past year, worse than the market's 3.59% drop. Despite a favorable ROCE and PEG ratio, investor confidence appears low due to declining participation and negative performance trends.

As of 23-Mar, Karnika Industries Ltd's stock price is experiencing a slight rise, currently at 114.00, with a change of 0.15 (0.13%) upward. This increase can be attributed to its performance today, where it outperformed its sector by 2.47%. However, it is important to note that the stock has faced significant challenges over the past year, with a decline of 14.85%, which is considerably worse than the broader market's decline of 3.59%.<BR><BR>Despite the recent uptick, the stock's overall performance in the last month has been negative, with a drop of 13.80%. Additionally, investor participation appears to be declining, as indicated by a 44.92% decrease in delivery volume compared to the 5-day average. This suggests that while there may be short-term gains, the long-term outlook remains uncertain, particularly given the flat results reported in December and the lack of investment from domestic mutual funds, which hold 0% of the company.<BR><BR>The company's financial metrics show a return on capital employed (ROCE) of 16.7 and a favorable PEG ratio of 0.5, indicating attractive valuation relative to its earnings growth. However, the significant underperformance compared to the market over the past year raises concerns about investor confidence. Overall, while there is a minor rise in the stock price currently, the broader context suggests ongoing challenges that could impact its future performance.

View full answer

Why is Karnika Industries Ltd falling/rising?

25-Mar-2026

As of 24-Mar, Karnika Industries Ltd's stock price is at 114.00, unchanged from the previous day, and has underperformed the sector by 2.59%. The stock has seen significant declines over various periods, with a year-to-date drop of 2.94% and a notable decrease in investor participation, indicating a lack of confidence.

As of 24-Mar, Karnika Industries Ltd's stock price is currently at 114.00, showing no change from the previous day. The stock has underperformed in comparison to the sector by 2.59% today. Over the past week, the stock has decreased by 0.87%, while the benchmark Sensex has fallen by 2.84%. In the last month, Karnika Industries Ltd has experienced a significant decline of 20.92%, compared to a 9.88% drop in the Sensex. Year-to-date, the stock is down 2.94%, while the Sensex has decreased by 12.31%. Over the past year, the stock has fallen by 13.50%, in contrast to the Sensex's decline of only 3.15%.<BR><BR>Additionally, the stock's performance is reflected in its moving averages, where it is higher than the 5-day moving average but lower than the 20-day, 50-day, 100-day, and 200-day moving averages. This indicates a short-term improvement but a longer-term weakness. Furthermore, there has been a notable decline in investor participation, with delivery volume on 23 March dropping by 86.96% compared to the 5-day average. This decrease in trading activity suggests a lack of investor confidence, contributing to the stock's downward trend. Overall, the combination of poor performance relative to the sector, significant declines over various periods, and falling investor participation are key factors contributing to the stock's current status.

View full answer

Why is Karnika Industries Ltd falling/rising?

26-Mar-2026

As of 25-Mar, Karnika Industries Ltd's stock price has declined to 109.00, down 4.39%, due to significant underperformance against the Sensex and low investor participation. The stock is trading below its moving averages and is close to its 52-week low, indicating a bearish trend despite a reported profit increase.

As of 25-Mar, Karnika Industries Ltd is experiencing a decline in its stock price, currently at 109.00, reflecting a change of -5.0 (-4.39%). This downward movement can be attributed to several factors highlighted in the provided data. <BR><BR>Firstly, the stock has underperformed significantly compared to the benchmark Sensex, with a one-week decline of -4.51% against the Sensex's -1.98%. Over the past month, the stock has dropped by -17.20%, while the Sensex has only fallen by -8.54%. This trend indicates a consistent underperformance relative to the broader market.<BR><BR>Additionally, the stock is trading below its moving averages across various time frames, including the 5-day, 20-day, 50-day, 100-day, and 200-day moving averages, suggesting a bearish trend. The stock is also close to its 52-week low, being only 2.71% away from a low of Rs 106.05. <BR><BR>Investor participation has notably decreased, with a delivery volume of only 1,000 shares on March 24, which represents a staggering decline of -94.05% compared to the 5-day average delivery volume. This drop in trading activity may reflect a lack of confidence among investors.<BR><BR>Moreover, despite a reported profit increase of 79% over the past year, the stock has still generated a return of -15.47%, indicating that the market is not responding positively to the company's financial performance. The low stake held by domestic mutual funds, which is at 0%, may also signal a lack of confidence in the stock's valuation or business prospects.<BR><BR>In summary, the combination of underperformance against market benchmarks, declining investor participation, and trading below moving averages contributes to the falling stock price of Karnika Industries Ltd.

View full answer
iScoreScore
Click here to find our call on this stock
Strong Sell
Sell
Hold
Buy
Strong Buy

Dashboard

1

Flat results in Dec 25

 
2

Despite the size of the company, domestic mutual funds hold only 0% of the company

3

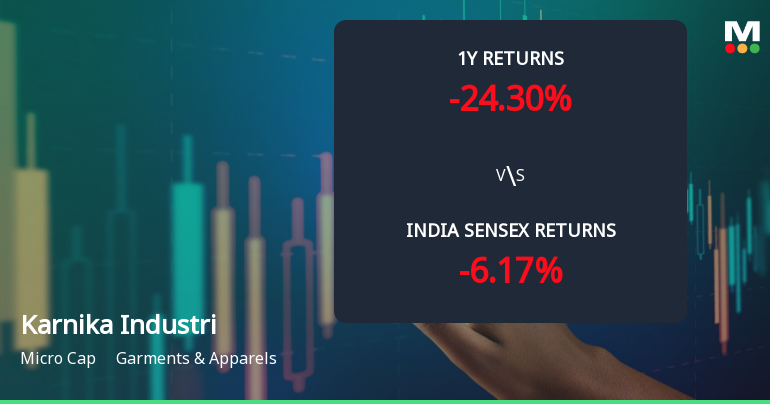
Below par performance in long term as well as near term

stock-summaryMojo Parameters

Mojo Parameters

Loading Valuation Snapshot...

Stock DNA

stock-summary
Industry

Garments & Apparels

stock-summary
Market cap

INR 709 Cr (Micro Cap)

stock-summary
P/E

34.00

stock-summary
Industry P/E

20

stock-summary
Dividend Yield

0.11%

stock-summary
Debt Equity

0.76

stock-summary
Return on Equity

21.29%

stock-summary
Price to Book

7.98

Revenue and Profits:
Net Sales:
60 Cr
(Quarterly Results - Dec 2025)
Net Profit:
6 Cr
stock-summaryTotal Returns
Total Returns (Price + Dividend) stock-summary
Dividend Yield (0.11%)
TimePeriod
Price Return
Dividend Return
Total Return
3 Months
-8.35%
0%
-8.35%
6 Months
-39.24%
0.06%
-39.18%
1 Year
-15.5%
0.08%
-15.42%
2 Years
79.98%
0.34%
80.32%
3 Years
0%
0%
0.0%
4 Years
0%
0%
0.0%
5 Years
0%
0%
0.0%

Latest dividend: 0.1 per share ex-dividend date: Nov-20-2025

Risk Adjusted Returns v/s stock-summary
Returns Beta
Icon
Beta has not been calculated since enough price history is not available
stock-summaryNews & Corporate Actions

Announcements stock-summary

Icon
No announcement available

Corporate Actions stock-summary

stock-summary
BOARD MEETING

No Upcoming Board Meetings

stock-summary
DIVIDEND

Karnika Industries Ltd has declared 1% dividend, ex-date: 20 Nov 25

stock-summary
SPLITS

No Splits history available

stock-summary
BONUS

Karnika Industries Ltd has announced 4:1 bonus issue, ex-date: 29 Aug 25

stock-summary
RIGHTS

No Rights history available

stock-summaryKey Factors

Quality key factors stock-summary

Factor
Value
Sales Growth (5y)
17.70%
EBIT Growth (5y)
29.78%
EBIT to Interest (avg)
3.99
Debt to EBITDA (avg)
2.42
Net Debt to Equity (avg)
0.76
Sales to Capital Employed (avg)
1.23
Tax Ratio
25.40%
Dividend Payout Ratio
0
Pledged Shares
0
Institutional Holding
0
ROCE (avg)
17.90%
ROE (avg)
25.47%

Valuation key factors

Factor
Value
P/E Ratio
34
Industry P/E
0
Price to Book Value
7.98
EV to EBIT
29.70
EV to EBITDA
28.41
EV to Capital Employed
4.97
EV to Sales
4.29
PEG Ratio
0.05
Dividend Yield
0.11%
ROCE (Latest)
16.74%
ROE (Latest)
21.29%

Technicals key factors

Indicator
Weekly
Monthly
MACD
Bearish
RSI
No Signal
No Signal
Bollinger Bands
Bearish
Bearish
Moving Averages
Bearish (Daily)
KST
Mildly Bullish
Dow Theory
No Trend
Mildly Bullish
OBV
No Trend
Mildly Bearish
stock-summary Technical Indicator Scale: Bearish, Mildly Bearish, Sideways, Mildly Bullish, Bullish  Turned 
stock-summaryShareholding
Shareholding Snapshot : Dec 2025stock-summary
Shareholding Compare (%holding) stock-summary
Majority shareholders

Promoters

Pledged Promoter Holdings

None

Mutual Funds

Held by 0 Schemes

FIIs

Held by 0 FIIs

Promoter with highest holding

Niranjan Mundhra (24.46%)

Highest Public shareholder

None

Individual Investors Holdings

13.59%

stock-summaryFinancial
[
  {
    "link": "quarterly",
    "btn_text": "All Quarterly Results",
    "header": "Quarterly Results Snapshot (Standalone) - Dec'25 - QoQ",
    "rhs": [
      {
        "prefix": "Net Sales ",
        "suffix": "QoQ Growth in quarter ended Dec 2025 is -13.35% vs 109.46% in Sep 2025",
        "dir": -1
      },
      {
        "prefix": "Standalone Net Profit ",
        "suffix": "QoQ Growth in quarter ended Dec 2025 is -33.01% vs 204.87% in Sep 2025",
        "dir": -1
      }
    ],
    "table": {
      "header": [
        "Dec'25",
        "Sep'25",
        "Change(%)"
      ],
      "body": [
        {
          "field": "Net Sales",
          "val1": "60.42",
          "val2": "69.73",
          "chgp": "-13.35%",
          "chgp_class": "negative"
        },
        {
          "field": "Operating Profit (PBDIT) excl Other Income",
          "val1": "9.76",
          "val2": "14.45",
          "chgp": "-32.46%",
          "chgp_class": "negative"
        },
        {
          "field": "Interest",
          "val1": "1.36",
          "val2": "1.39",
          "chgp": "-2.16%",
          "chgp_class": "positive"
        },
        {
          "field": "Exceptional Items",
          "val1": "0.00",
          "val2": "0.00",
          "chgp": "",
          "chgp_class": "neutral"
        },
        {
          "field": "Standalone Net Profit",
          "val1": "6.29",
          "val2": "9.39",
          "chgp": "-33.01%",
          "chgp_class": "negative"
        },
        {
          "field": "Operating Profit Margin (Excl OI)",
          "val1": "16.15%",
          "val2": "20.72%",
          "chgp": "-4.57%",
          "chgp_class": "negative"
        }
      ]
    }
  },
  {
    "link": "half-yearly",
    "btn_text": "All Half Yearly Results",
    "header": "Half Yearly Results Snapshot (Standalone) - Sep'25",
    "rhs": [
      {
        "prefix": "Net Sales ",
        "suffix": " Growth in half year ended Sep 2025 is 36.60% vs -22.37% in Mar 2025",
        "dir": 1
      },
      {
        "prefix": "Standalone Net Profit ",
        "suffix": " Growth in half year ended Sep 2025 is 62.24% vs -25.80% in Mar 2025",
        "dir": 1
      }
    ],
    "table": {
      "header": [
        "Sep'25",
        "Mar'25",
        "Change(%)"
      ],
      "body": [
        {
          "field": "Net Sales",
          "val1": "103.01",
          "val2": "75.41",
          "chgp": "36.60%",
          "chgp_class": "positive"
        },
        {
          "field": "Operating Profit (PBDIT) excl Other Income",
          "val1": "19.43",
          "val2": "10.98",
          "chgp": "76.96%",
          "chgp_class": "positive"
        },
        {
          "field": "Interest",
          "val1": "2.74",
          "val2": "2.31",
          "chgp": "18.61%",
          "chgp_class": "negative"
        },
        {
          "field": "Exceptional Items",
          "val1": "0.00",
          "val2": "0.00",
          "chgp": "",
          "chgp_class": "neutral"
        },
        {
          "field": "Standalone Net Profit",
          "val1": "12.46",
          "val2": "7.68",
          "chgp": "62.24%",
          "chgp_class": "positive"
        },
        {
          "field": "Operating Profit Margin (Excl OI)",
          "val1": "18.86%",
          "val2": "14.56%",
          "chgp": "4.30%",
          "chgp_class": "positive"
        }
      ]
    }
  },
  {
    "link": "nine-monthly",
    "btn_text": "All Nine Monthly Results",
    "header": "Nine Monthly Results Snapshot (Standalone) - Dec'25",
    "rhs": [
      {
        "prefix": "Net Sales ",
        "suffix": "YoY Growth in nine months ended Dec 2025 is 45.69% vs -10.08% in Dec 2024",
        "dir": 1
      },
      {
        "prefix": "Standalone Net Profit ",
        "suffix": "YoY Growth in nine months ended Dec 2025 is 59.44% vs 8.89% in Dec 2024",
        "dir": 1
      }
    ],
    "table": {
      "header": [
        "Dec'25",
        "Dec'24",
        "Change(%)"
      ],
      "body": [
        {
          "field": "Net Sales",
          "val1": "163.43",
          "val2": "112.18",
          "chgp": "45.69%",
          "chgp_class": "positive"
        },
        {
          "field": "Operating Profit (PBDIT) excl Other Income",
          "val1": "29.19",
          "val2": "18.07",
          "chgp": "61.54%",
          "chgp_class": "positive"
        },
        {
          "field": "Interest",
          "val1": "4.10",
          "val2": "3.14",
          "chgp": "30.57%",
          "chgp_class": "negative"
        },
        {
          "field": "Exceptional Items",
          "val1": "0.00",
          "val2": "0.00",
          "chgp": "",
          "chgp_class": "neutral"
        },
        {
          "field": "Standalone Net Profit",
          "val1": "18.75",
          "val2": "11.76",
          "chgp": "59.44%",
          "chgp_class": "positive"
        },
        {
          "field": "Operating Profit Margin (Excl OI)",
          "val1": "17.86%",
          "val2": "16.11%",
          "chgp": "1.75%",
          "chgp_class": "positive"
        }
      ]
    }
  },
  {
    "link": "annual",
    "btn_text": "All Annual Results",
    "header": "Annual Results Snapshot (Standalone) - Mar'25",
    "rhs": [
      {
        "prefix": "Net Sales ",
        "suffix": "YoY Growth in year ended Mar 2025 is 35.58% vs 2.15% in Mar 2024",
        "dir": 1
      },
      {
        "prefix": "Standalone Net Profit ",
        "suffix": "YoY Growth in year ended Mar 2025 is 78.51% vs 23.47% in Mar 2024",
        "dir": 1
      }
    ],
    "table": {
      "header": [
        "Mar'25",
        "Mar'24",
        "Change(%)"
      ],
      "body": [
        {
          "field": "Net Sales",
          "val1": "172.55",
          "val2": "127.27",
          "chgp": "35.58%",
          "chgp_class": "positive"
        },
        {
          "field": "Operating Profit (PBDIT) excl Other Income",
          "val1": "26.04",
          "val2": "18.08",
          "chgp": "44.03%",
          "chgp_class": "positive"
        },
        {
          "field": "Interest",
          "val1": "4.46",
          "val2": "4.89",
          "chgp": "-8.79%",
          "chgp_class": "positive"
        },
        {
          "field": "Exceptional Items",
          "val1": "0.00",
          "val2": "0.00",
          "chgp": "",
          "chgp_class": "neutral"
        },
        {
          "field": "Standalone Net Profit",
          "val1": "18.03",
          "val2": "10.10",
          "chgp": "78.51%",
          "chgp_class": "positive"
        },
        {
          "field": "Operating Profit Margin (Excl OI)",
          "val1": "15.09%",
          "val2": "14.21%",
          "chgp": "0.88%",
          "chgp_class": "positive"
        }
      ]
    }
  }
]

Quarterly Results Snapshot (Standalone) - Dec'25 - QoQstock-summary

Dec'25
Sep'25
Change(%)
Net Sales
60.42
69.73
-13.35%
Operating Profit (PBDIT) excl Other Income
9.76
14.45
-32.46%
Interest
1.36
1.39
-2.16%
Exceptional Items
0.00
0.00
Standalone Net Profit
6.29
9.39
-33.01%
Operating Profit Margin (Excl OI)
16.15%
20.72%
-4.57%
Values in Rs Cr.
Direction Arrows
Net Sales

QoQ Growth in quarter ended Dec 2025 is -13.35% vs 109.46% in Sep 2025

Direction Arrows
Standalone Net Profit

QoQ Growth in quarter ended Dec 2025 is -33.01% vs 204.87% in Sep 2025

Half Yearly Results Snapshot (Standalone) - Sep'25stock-summary

Sep'25
Mar'25
Change(%)
Net Sales
103.01
75.41
36.60%
Operating Profit (PBDIT) excl Other Income
19.43
10.98
76.96%
Interest
2.74
2.31
18.61%
Exceptional Items
0.00
0.00
Standalone Net Profit
12.46
7.68
62.24%
Operating Profit Margin (Excl OI)
18.86%
14.56%
4.30%
Values in Rs Cr.
Direction Arrows
Net Sales

Growth in half year ended Sep 2025 is 36.60% vs -22.37% in Mar 2025

Direction Arrows
Standalone Net Profit

Growth in half year ended Sep 2025 is 62.24% vs -25.80% in Mar 2025

Nine Monthly Results Snapshot (Standalone) - Dec'25stock-summary

Dec'25
Dec'24
Change(%)
Net Sales
163.43
112.18
45.69%
Operating Profit (PBDIT) excl Other Income
29.19
18.07
61.54%
Interest
4.10
3.14
30.57%
Exceptional Items
0.00
0.00
Standalone Net Profit
18.75
11.76
59.44%
Operating Profit Margin (Excl OI)
17.86%
16.11%
1.75%
Values in Rs Cr.
Direction Arrows
Net Sales

YoY Growth in nine months ended Dec 2025 is 45.69% vs -10.08% in Dec 2024

Direction Arrows
Standalone Net Profit

YoY Growth in nine months ended Dec 2025 is 59.44% vs 8.89% in Dec 2024

Annual Results Snapshot (Standalone) - Mar'25stock-summary

Mar'25
Mar'24
Change(%)
Net Sales
172.55
127.27
35.58%
Operating Profit (PBDIT) excl Other Income
26.04
18.08
44.03%
Interest
4.46
4.89
-8.79%
Exceptional Items
0.00
0.00
Standalone Net Profit
18.03
10.10
78.51%
Operating Profit Margin (Excl OI)
15.09%
14.21%
0.88%
Values in Rs Cr.
Direction Arrows
Net Sales

YoY Growth in year ended Mar 2025 is 35.58% vs 2.15% in Mar 2024

Direction Arrows
Standalone Net Profit

YoY Growth in year ended Mar 2025 is 78.51% vs 23.47% in Mar 2024

stock-summaryCompany CV
About Karnika Industries Ltd stock-summary
stock-summary
Karnika Industries Ltd
Micro Cap
Garments & Apparels
Karnika Industries Ltd was originally formed as a Partnership Firm under the Partnership Act, 1932 in the name and style of "Karni International" pursuant to Deed of Partnership dated July 21, 2017. Karni International was thereafter converted from Partnership Firm into Public Limited Company with the name and style of "Karnika Industries Limited" through Certificate of Incorporation from the Registrar of Companies, Kolkata dated April 13, 2022.
Company Coordinates stock-summary
Icon
No Company Details Available