
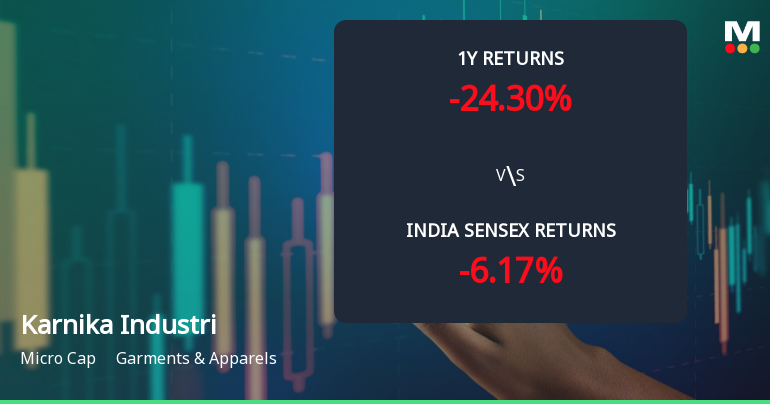
Karnika Industries Ltd Faces Intensified Downtrend Amid Technical Deterioration
2026-07-07 08:08:12Karnika Industries Ltd, a micro-cap player in the Garments & Apparels sector, has seen a marked deterioration in its technical outlook, with key momentum indicators signalling a shift from a mildly bearish stance to a more pronounced bearish trend. The stock’s recent price action, combined with weakening technical parameters, underscores mounting selling pressure and a challenging near-term outlook for investors.
Read full news article
Karnika Industries Ltd Valuation Shifts Signal Renewed Price Attractiveness Amid Market Downturn
2026-07-07 08:01:16Karnika Industries Ltd, a micro-cap player in the Garments & Apparels sector, has seen a marked improvement in its valuation parameters, shifting from an attractive to a very attractive rating. Despite recent share price weakness, the company’s price-to-earnings (P/E) and price-to-book value (P/BV) ratios now present a compelling case for investors seeking value in a challenging market environment.
Read full news articleAre Karnika Industries Ltd latest results good or bad?
2026-07-05 19:10:59Karnika Industries Ltd's latest financial results for Q1 FY27 present a mixed picture of operational performance. The consolidated net profit for the quarter stood at ₹8.99 crores, reflecting a slight quarter-on-quarter increase of 0.22%. Net sales also showed a quarter-on-quarter improvement, reaching ₹73.77 crores, which is a 2.83% rise from the previous quarter. However, the operating margin, while improving significantly to 17.23% from 10.71%, indicates volatility, as it has fluctuated considerably over recent quarters. The profit after tax margin for Q1 FY27 was 12.39%, slightly lower than the 12.99% recorded in Q4 FY26, suggesting some compression in earnings quality despite the rise in operating margins. A notable concern is the sharp decline in other income, which fell to ₹1.71 crores from ₹7.15 crores in the previous quarter, raising questions about the sustainability of earnings. Employee costs ...
Read full news article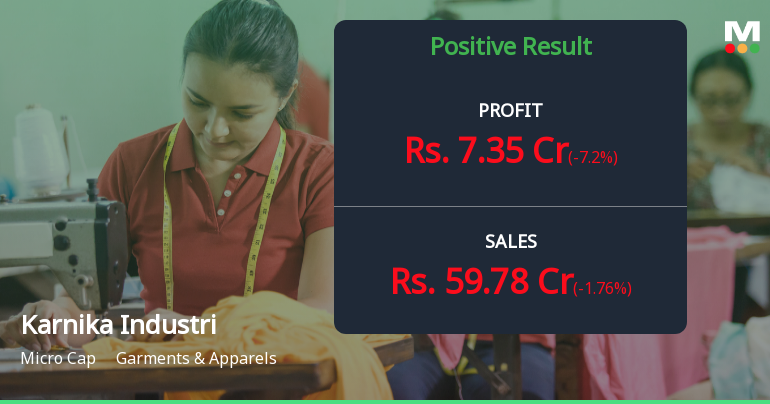
Karnika Industries Q1 FY27: Modest Growth Masks Margin Concerns as Stock Plunges 50% from Peak
2026-07-04 23:45:27Karnika Industries Ltd., a micro-cap garments and apparels manufacturer, delivered a subdued performance in Q1 FY27, reporting consolidated net profit of ₹8.99 crores—a marginal 0.22% quarter-on-quarter increase. With a market capitalisation of ₹707.00 crores, the company's shares have tumbled 50.32% from their 52-week high of ₹224.95, currently trading at ₹111.75 following a sharp 3.20% decline. The quarter revealed troubling margin compression despite revenue growth, raising questions about operational efficiency and competitive positioning in an increasingly challenging textile landscape.
Read full news article
Karnika Industries Ltd is Rated Sell
2026-07-01 10:11:08Karnika Industries Ltd is rated Sell by MarketsMOJO, with this rating last updated on 19 June 2026. However, the analysis and financial metrics discussed here reflect the stock’s current position as of 01 July 2026, providing investors with the latest insights into its performance and outlook.
Read full news article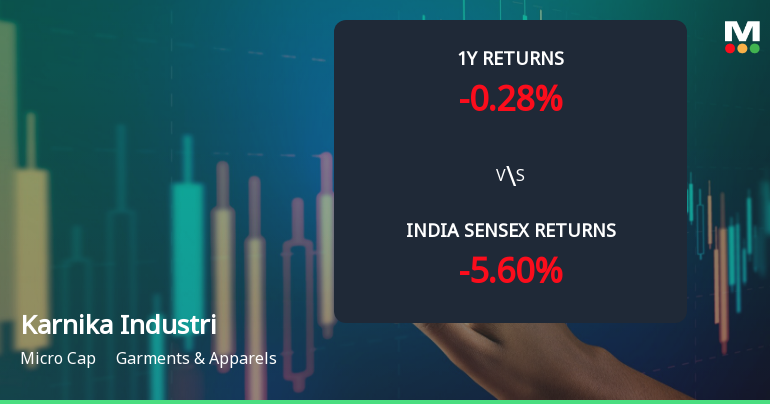
Karnika Industries Ltd Technical Momentum Shifts Amid Mixed Market Signals
2026-06-22 08:03:42Karnika Industries Ltd, a micro-cap player in the Garments & Apparels sector, has experienced a notable shift in its technical momentum, moving from a sideways trend to a mildly bearish stance. Recent technical indicators reveal a complex interplay of bullish and bearish signals, prompting a downgrade in its Mojo Grade from Hold to Sell as of 19 June 2026.
Read full news article
Karnika Industries Ltd is Rated Sell by MarketsMOJO
2026-06-20 10:10:29Karnika Industries Ltd is rated Sell by MarketsMOJO, with this rating last updated on 19 June 2026. While the rating change occurred on that date, the analysis and financial metrics discussed here reflect the stock’s current position as of 20 June 2026, providing investors with the most up-to-date view of the company’s fundamentals and market performance.
Read full news article
Karnika Industries Ltd Technical Momentum Shifts Amid Sideways Trend
2026-06-15 08:05:43Karnika Industries Ltd, a micro-cap player in the Garments & Apparels sector, has witnessed a notable shift in its technical momentum, moving from a mildly bearish stance to a sideways trend. Despite a modest decline of 1.19% on 15 Jun 2026, the stock’s technical indicators present a complex picture, with mixed signals from MACD, RSI, Bollinger Bands, and moving averages, prompting a reassessment of its near-term outlook.
Read full news article
Karnika Industries Ltd is Rated Sell
2026-06-09 10:10:44Karnika Industries Ltd is rated 'Sell' by MarketsMOJO, with this rating last updated on 08 June 2026. However, the analysis and financial metrics discussed below reflect the stock's current position as of 09 June 2026, providing investors with the latest insights into the company’s performance and outlook.
Read full news article
Corporate Actions

No Upcoming Board Meetings

Karnika Industries Ltd has declared 1% dividend, ex-date: 20 Nov 25

No Splits history available

Karnika Industries Ltd has announced 4:1 bonus issue, ex-date: 29 Aug 25

No Rights history available


