
Compare Kartik Invest. with Similar Stocks
Total Returns (Price + Dividend) 
Kartik Invest. for the last several years.
Risk Adjusted Returns v/s
Returns Beta

News
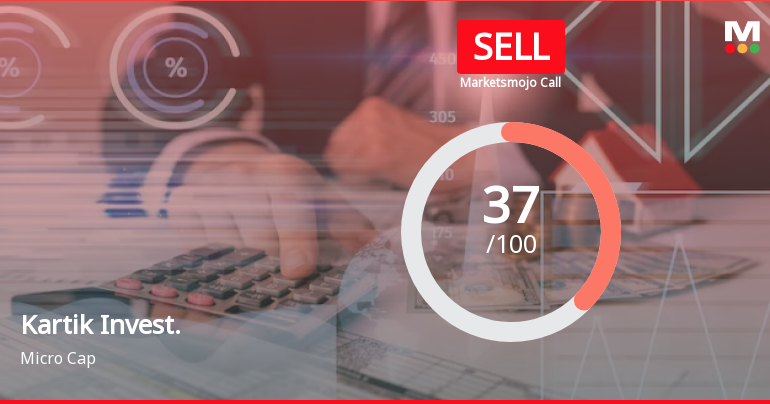
Kartik Investments Trust Ltd is Rated Sell
Kartik Investments Trust Ltd is rated 'Sell' by MarketsMOJO, with this rating last updated on 09 Feb 2026. However, the analysis and financial metrics discussed here reflect the stock’s current position as of 24 June 2026, providing investors with an up-to-date perspective on its fundamentals, valuation, financial trend, and technical outlook.
Read full news article
Kartik Investments Trust Ltd is Rated Sell
Kartik Investments Trust Ltd is rated 'Sell' by MarketsMOJO, with this rating last updated on 09 Feb 2026. However, the analysis and financial metrics discussed here reflect the stock's current position as of 12 June 2026, providing investors with an up-to-date view of the company’s fundamentals, valuation, financial trends, and technical outlook.
Read full news article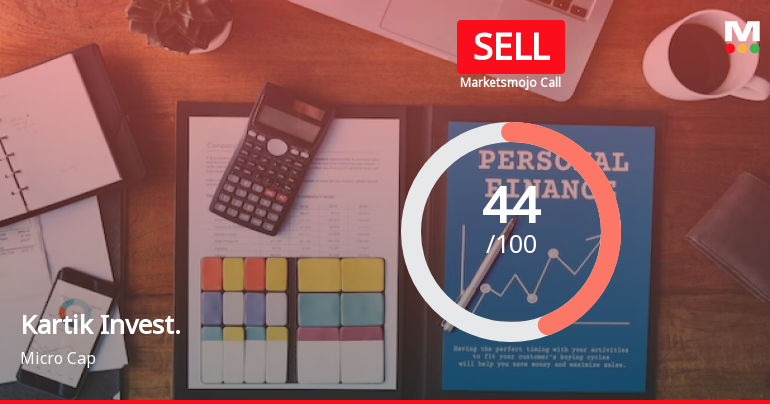
Kartik Investments Trust Ltd is Rated Sell
Kartik Investments Trust Ltd is rated 'Sell' by MarketsMOJO, with this rating last updated on 09 Feb 2026. However, the analysis and financial metrics discussed here reflect the stock's current position as of 26 May 2026, providing investors with an up-to-date view of the company’s fundamentals, valuation, financial trend, and technical outlook.
Read full news article Announcements
Intimation Of No-Objection Received For Reclassification Of Promoter Group To Public Under Regulation 31A Of SEBI Listing Regulations
13-May-2026 | Source : BSEIntimation of No-Objection received for reclassification of Promoter Group to Public under Regulation 31A of SEBI Listing Regulations
Board Meeting Outcome for Intimation Of Board Meeting Outcome
05-May-2026 | Source : BSEIntimation of outcome of Board Meeting to consider the audited financial results for the quarter and year ended 31 March 2026
Audited Financial Results For The Quarter And Year Ended 31 March 2026
05-May-2026 | Source : BSEAudited Financial results for the quarter and year ended 31 March 2026
Corporate Actions

No Upcoming Board Meetings

No Dividend history available

No Splits history available

No Bonus history available

No Rights history available
Quality key factors
Valuation key factors
Technicals key factors
 Technical Indicator Scale: Bearish, Mildly Bearish, Sideways, Mildly Bullish, Bullish Turned
 Shareholding Snapshot : Mar 2026
Shareholding Compare (%holding)
Promoters
None
Held by 0 Schemes
Held by 0 FIIs
Ambadi Investments Limited (30.64%)
Igft Private Limited (4.14%)
12.68%
Quarterly Results Snapshot (Standalone) - Mar'26 - YoY
YoY Growth in quarter ended Mar 2026 is 0.00% vs 0.00% in Mar 2025

YoY Growth in quarter ended Mar 2026 is 200.00% vs 50.00% in Mar 2025
Half Yearly Results Snapshot (Standalone) - Sep'23
Growth in half year ended Sep 2023 is 0.00% vs 0.00% in Sep 2022

Growth in half year ended Sep 2023 is 0.00% vs 100.00% in Sep 2022
Nine Monthly Results Snapshot (Standalone) - Dec'23
YoY Growth in nine months ended Dec 2023 is 100.00% vs 0.00% in Dec 2022
YoY Growth in nine months ended Dec 2023 is 200.00% vs 66.67% in Dec 2022
Annual Results Snapshot (Standalone) - Mar'26
YoY Growth in year ended Mar 2026 is 29,250.00% vs -50.00% in Mar 2025
YoY Growth in year ended Mar 2026 is 17,100.00% vs -200.00% in Mar 2025
About Kartik Investments Trust Ltd

Company Coordinates


