
Compare Kaveri Seed Co. with Similar Stocks
Dashboard
High Management Efficiency with a high ROE of 19.27%
The company is Net-Debt Free
Poor long term growth as Net Sales has grown by an annual rate of 6.16% and Operating profit at 0.07% over the last 5 years
Flat results in Mar 26
With ROE of 16.8, it has a Very Attractive valuation with a 2.7 Price to Book Value
High Institutional Holdings at 21.41%
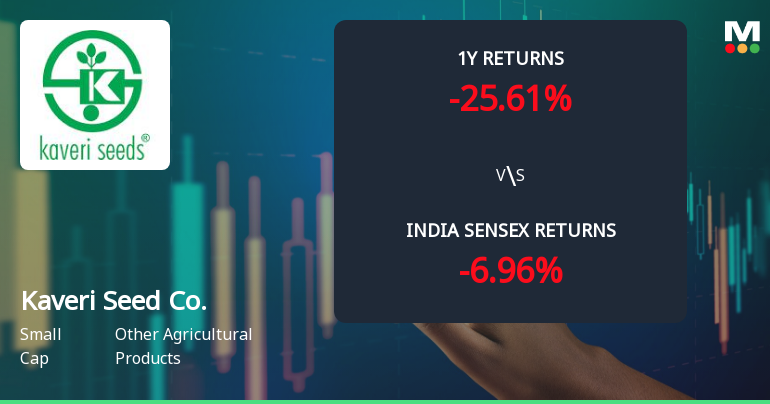
Underperformed the market in the last 1 year
Stock DNA
Other Agricultural Products
INR 4,750 Cr (Small Cap)
16.00
14
0.59%
-0.25
16.84%
2.70
Total Returns (Price + Dividend) 
Latest dividend: 5 per share ex-dividend date: Nov-12-2025
Risk Adjusted Returns v/s
Returns Beta

News
Kaveri Seed Company Ltd Technical Momentum Shifts Amid Mixed Market Signals
Kaveri Seed Company Ltd has experienced a notable shift in its technical momentum, moving from a sideways trend to a mildly bullish stance on weekly charts, despite mixed signals from monthly indicators. The stock’s recent downgrade to a Hold rating from Sell by MarketsMOJO reflects this nuanced outlook, as investors weigh short-term optimism against longer-term caution in the Other Agricultural Products sector.
Read full news article
Kaveri Seed Company Ltd Sees Technical Momentum Shift Amid Mixed Market Signals
Kaveri Seed Company Ltd has witnessed a notable shift in its technical momentum, moving from a mildly bearish stance to a more neutral sideways trend. This transition is underscored by a complex interplay of technical indicators, including MACD, RSI, Bollinger Bands, and moving averages, signalling a nuanced outlook for this small-cap player in the Other Agricultural Products sector.
Read full news article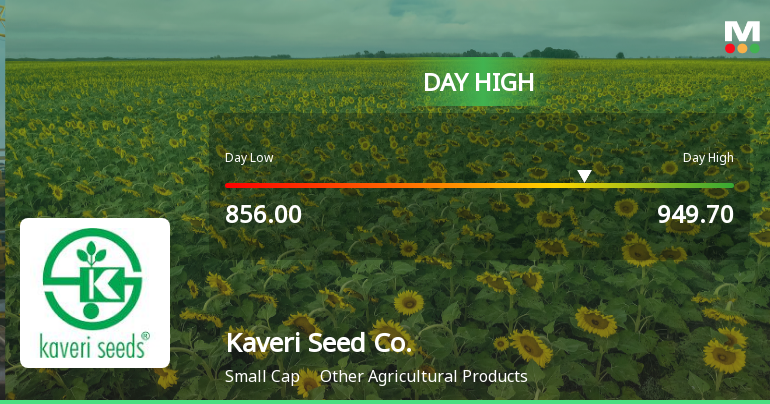
Kaveri Seed Company Ltd Surges 7.67% to Day's High of Rs 920 — Outperforms Sector by 3.44 Percentage Points
The Sensex advanced 0.6% on 22 Jun 2026, yet Kaveri Seed Company Ltd outpaced the broader market with a robust 7.67% gain, touching an intraday high of Rs 920. This 3.44 percentage-point outperformance over the Agri-Seeds sector's 4.23% rise signals a distinctly stock-specific momentum shift rather than a mere market tailwind.
Read full news article Announcements
Closure of Trading Window
24-Jun-2026 | Source : BSEIntimation for Closure of Trading Window
Announcement under Regulation 30 (LODR)-Newspaper Publication
18-Jun-2026 | Source : BSECopies of Newspaper Advertisement published in Business Standard and Nava Telangana on June 18 2026 regarding Transfer of equity shares to IEPF Suspense Account in respect of which dividend has not been claimed for seven consecutive years or more as per IEPF Rules 2016.
Intimation Of Receipt Of Notice Of Hearing From The Income Tax Appellate Tribunal
03-Jun-2026 | Source : BSEIntimation of Receipt of Notice of Hearing from the Income Tax Appellate Tribunal Hyderabad Benches.
Corporate Actions

No Upcoming Board Meetings

Kaveri Seed Company Ltd has declared 250% dividend, ex-date: 12 Nov 25

Kaveri Seed Company Ltd has announced 2:10 stock split, ex-date: 27 Jan 14

No Bonus history available

No Rights history available
Quality key factors
Valuation key factors
Technicals key factors
 Technical Indicator Scale: Bearish, Mildly Bearish, Sideways, Mildly Bullish, Bullish Turned
 Shareholding Snapshot : Mar 2026
Shareholding Compare (%holding)
Promoters
None
Held by 7 Schemes (1.53%)
Held by 103 FIIs (18.55%)
G.v. Bhaskar Rao, Trustee Of Madhushree Private Trust (19.61%)
Massachusetts Institute Of Technology (5.34%)
13.68%
Quarterly Results Snapshot (Consolidated) - Mar'26 - YoY

YoY Growth in quarter ended Mar 2026 is 18.68% vs -8.24% in Mar 2025
YoY Growth in quarter ended Mar 2026 is -21.23% vs -8,396.30% in Mar 2025
Half Yearly Results Snapshot (Consolidated) - Sep'25
Growth in half year ended Sep 2025 is 14.54% vs 3.66% in Sep 2024
Growth in half year ended Sep 2025 is 7.55% vs 0.56% in Sep 2024
Nine Monthly Results Snapshot (Consolidated) - Dec'25
YoY Growth in nine months ended Dec 2025 is 15.51% vs 6.16% in Dec 2024
YoY Growth in nine months ended Dec 2025 is 6.37% vs 1.76% in Dec 2024
Annual Results Snapshot (Consolidated) - Mar'26
YoY Growth in year ended Mar 2026 is 15.75% vs 4.93% in Mar 2025
YoY Growth in year ended Mar 2026 is 5.16% vs -5.83% in Mar 2025
About Kaveri Seed Company Ltd

Company Coordinates


