
Compare Kaya Ltd with Similar Stocks
Dashboard
With a Negative Book Value, the company has a Weak Long Term Fundamental Strength
- Poor long term growth as Net Sales has grown by an annual rate of -4.15% over the last 5 years
- Company's ability to service its debt is weak with a poor EBIT to Interest (avg) ratio of -6.21
The company has declared Negative results for the last 9 consecutive quarters
Risky - Negative EBITDA
Below par performance in long term as well as near term
Stock DNA
Leisure Services
INR 398 Cr (Micro Cap)
NA (Loss Making)
43
0.00%
-1.67
62.01%
-2.58
Total Returns (Price + Dividend) 
Kaya Ltd for the last several years.
Risk Adjusted Returns v/s
Returns Beta

News

Kaya Ltd is Rated Strong Sell
Kaya Ltd is rated Strong Sell by MarketsMOJO, with this rating last updated on 29 September 2025. However, the analysis and financial metrics discussed here reflect the stock's current position as of 22 June 2026, providing investors with an up-to-date view of the company's performance and outlook.
Read full news article
Kaya Ltd is Rated Strong Sell
Kaya Ltd is rated Strong Sell by MarketsMOJO, with this rating last updated on 29 Sep 2025. However, the analysis and financial metrics discussed here reflect the stock’s current position as of 10 June 2026, providing investors with an up-to-date view of the company’s fundamentals, returns, and market performance.
Read full news article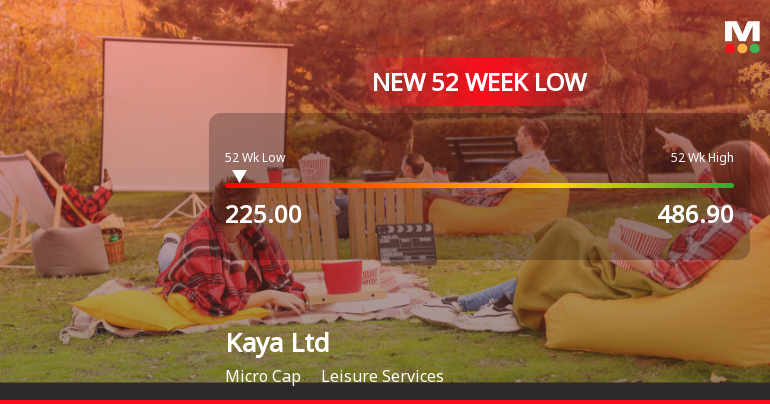
Kaya Ltd Falls to 52-Week Low of Rs 225 as Sell-Off Deepens
For the fifth consecutive session, Kaya Ltd has closed lower, culminating in a fresh 52-week low of Rs 225 on 2 Jun 2026. This marks a 6.13% decline over the past five days, underscoring sustained selling pressure despite the broader market's modest recovery.
Read full news article Announcements
Announcement under Regulation 30 (LODR)-Change in Management
19-Jun-2026 | Source : BSEResignation of Ms. Amrita Chowdhury from the position of Vice president & Head Human Resource (SMP)
Announcement under Regulation 30 (LODR)-Allotment of ESOP / ESPS
27-May-2026 | Source : BSEGrant of ESOPs to eligible employees of the Company under the Employee Stock Option 2021 Scheme-V
Announcement under Regulation 30 (LODR)-Newspaper Publication
21-May-2026 | Source : BSENewspaper Publication of the audited Consolidated Financial Results for the quarter and financial year ended March 31 2026
Corporate Actions

No Upcoming Board Meetings

No Dividend history available

No Splits history available

No Bonus history available

No Rights history available
Quality key factors
Valuation key factors
Technicals key factors
 Technical Indicator Scale: Bearish, Mildly Bearish, Sideways, Mildly Bullish, Bullish Turned
 Shareholding Snapshot : Mar 2026
Shareholding Compare (%holding)
Promoters
None
Held by 0 Schemes
Held by 7 FIIs (0.68%)
Harsh C Mariwala With Late Kishore V Mariwala For Valentine Family Trust (9.37%)
Axana Estates Llp (13.76%)
22.48%
Quarterly Results Snapshot (Consolidated) - Mar'26 - YoY

YoY Growth in quarter ended Mar 2026 is 2.03% vs 5.54% in Mar 2025
YoY Growth in quarter ended Mar 2026 is -295.58% vs 92.93% in Mar 2025
Half Yearly Results Snapshot (Consolidated) - Sep'25

Growth in half year ended Sep 2025 is 2.18% vs -49.42% in Sep 2024
Growth in half year ended Sep 2025 is -137.75% vs 500.28% in Sep 2024
Nine Monthly Results Snapshot (Consolidated) - Dec'25
YoY Growth in nine months ended Dec 2025 is 2.58% vs -47.37% in Dec 2024
YoY Growth in nine months ended Dec 2025 is -175.42% vs 402.13% in Dec 2024
Annual Results Snapshot (Consolidated) - Mar'26
YoY Growth in year ended Mar 2026 is 2.45% vs 5.84% in Mar 2025
YoY Growth in year ended Mar 2026 is -214.93% vs 164.54% in Mar 2025
About Kaya Ltd

Company Coordinates


