
Compare KCL Infra with Similar Stocks
Total Returns (Price + Dividend) 
KCL Infra for the last several years.
Risk Adjusted Returns v/s
Returns Beta

News
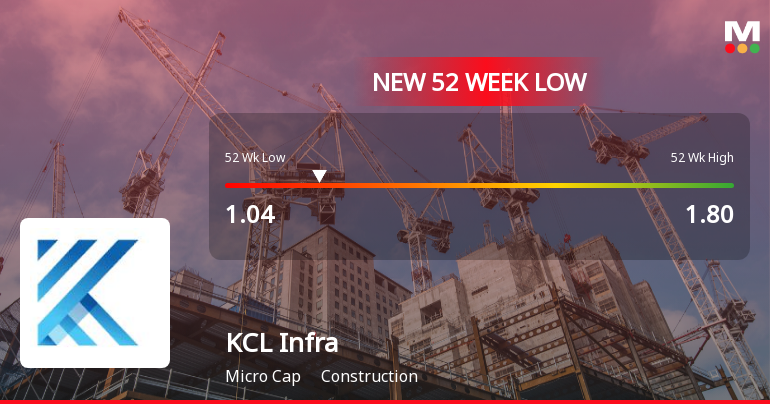
KCL Infra Projects Ltd Falls to 52-Week Low of Rs 1.04 as Sell-Off Deepens
A sharp decline over the past two sessions has dragged KCL Infra Projects Ltd to a fresh 52-week low of Rs 1.04 on 25 Jun 2026, marking a significant 42.2% drop from its peak of Rs 1.80 within the last year. This downturn comes despite some recent financial improvements, highlighting a complex interplay of valuation, market sentiment, and sector dynamics.
Read full news articleWhen is the next results date for KCL Infra Projects Ltd?
The next results date for KCL Infra Projects Ltd is scheduled for 30 May 2026....
Read full news article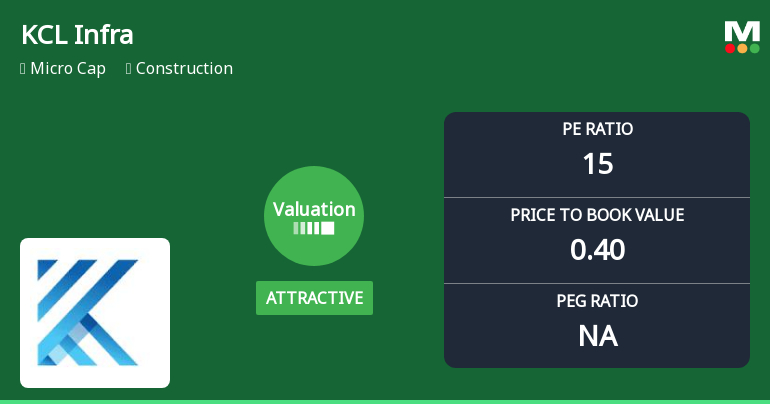
KCL Infra Projects Ltd Valuation Shifts Signal Changing Market Perception
KCL Infra Projects Ltd, a micro-cap player in the construction sector, has recently seen its valuation parameters shift from very attractive to attractive, reflecting a nuanced change in price attractiveness. Despite a modest decline in share price and mixed returns relative to the Sensex, the company’s price-to-earnings (P/E) and price-to-book value (P/BV) ratios suggest a compelling entry point for value-focused investors, even as its overall Mojo Grade was downgraded to Sell from Hold on 21 April 2026.
Read full news article Announcements
Compliances-Certificate under Reg. 74 (5) of SEBI (DP) Regulations 2018
16-Jul-2026 | Source : BSECertificate under Regulation 74 (5) of SEBI (DP) Regulations. 2018 for the Quarter ended 30th June 2026.
Closure of Trading Window
23-Jun-2026 | Source : BSEIntimation of Closure of Trading Window
Board Meeting Outcome for Outcome Of Board Meeting- Disclosure Of Corporate Office Of The Company Under Regulation 30 Of The SEBI (Listing Obligations & Disclosure Requirements) Regulations 2015.
17-Jun-2026 | Source : BSEOutcome of Board Meeting- Disclosure of Corporate Office of the Company under Regulation 30 of the SEBI (Listing Obligations & Disclosure Requirements) Regulations 2015.
Corporate Actions

No Upcoming Board Meetings

No Dividend history available

KCL Infra Projects Ltd has announced 2:10 stock split, ex-date: 29 Oct 09

No Bonus history available

KCL Infra Projects Ltd has announced 9:1 rights issue, ex-date: 05 Aug 22
Quality key factors
Valuation key factors
Technicals key factors
 Technical Indicator Scale: Bearish, Mildly Bearish, Sideways, Mildly Bullish, Bullish Turned
 Shareholding Snapshot : Jun 2026
Shareholding Compare (%holding)
Non Institution
0.1598
Held by 0 Schemes
Held by 0 FIIs
Mohan Jhawar (22.84%)
Jr Seamless Private Limited (6.17%)
65.26%
Quarterly Results Snapshot (Standalone) - Mar'26 - QoQ

QoQ Growth in quarter ended Mar 2026 is 243.78% vs 1,160.78% in Dec 2025
QoQ Growth in quarter ended Mar 2026 is -80.00% vs 433.33% in Dec 2025
Half Yearly Results Snapshot (Standalone) - Sep'25

Growth in half year ended Sep 2025 is -3.35% vs -58.08% in Sep 2024
Growth in half year ended Sep 2025 is 30.77% vs -71.11% in Sep 2024
Nine Monthly Results Snapshot (Standalone) - Dec'25
YoY Growth in nine months ended Dec 2025 is 378.36% vs -56.30% in Dec 2024
YoY Growth in nine months ended Dec 2025 is 182.35% vs -63.83% in Dec 2024
Annual Results Snapshot (Standalone) - Mar'26
YoY Growth in year ended Mar 2026 is 383.16% vs 42.17% in Mar 2025
YoY Growth in year ended Mar 2026 is 219.23% vs -40.23% in Mar 2025
About KCL Infra Projects Ltd

Company Coordinates


