
Compare KEC Internationa with Similar Stocks
Dashboard
Company's ability to service its debt is weak with a poor EBIT to Interest (avg) ratio of 1.87
- Company's ability to service its debt is weak with a poor EBIT to Interest (avg) ratio of 1.87
- The company has been able to generate a Return on Equity (avg) of 8.91% signifying low profitability per unit of shareholders funds
- PBT LESS OI(Q) At Rs 227.64 cr has Fallen at -29.30%
- PAT(Q) At Rs 192.79 cr has Fallen at -28.1%
- DEBTORS TURNOVER RATIO(HY) Lowest at 3.63 times
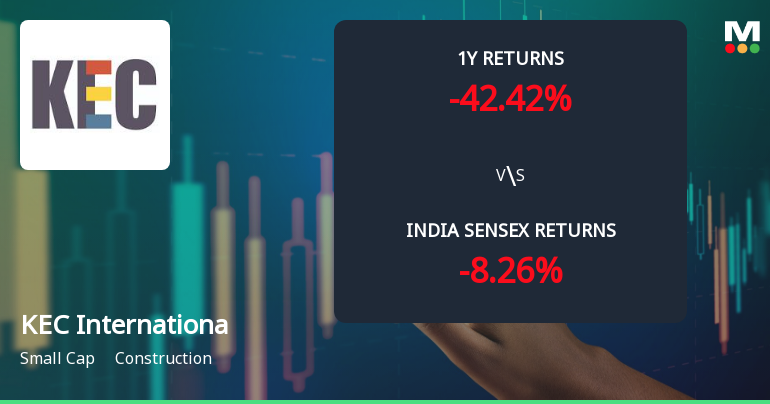
Below par performance in long term as well as near term
Stock DNA
Construction
INR 13,273 Cr (Small Cap)
20.00
32
1.09%
0.79
10.59%
2.12
Total Returns (Price + Dividend) 
Latest dividend: 5.5 per share ex-dividend date: Jul-25-2025
Risk Adjusted Returns v/s
Returns Beta

News
KEC International Ltd Technical Momentum Shifts Amid Bearish Sentiment
KEC International Ltd, a key player in the construction sector, is currently navigating a complex technical landscape marked by a shift from bearish to mildly bearish momentum. Despite a marginal day change of -0.01%, the stock’s technical indicators reveal nuanced signals that suggest cautious investor sentiment amid broader market pressures.
Read full news article
KEC International Downgraded to Strong Sell Amid Weak Financials and Bearish Technicals
KEC International Ltd, a key player in the construction sector specialising in transmission towers and equipment, has seen its investment rating downgraded from Sell to Strong Sell as of 1 June 2026. This shift reflects deteriorating technical indicators, disappointing financial trends, and concerns over valuation and quality metrics, signalling caution for investors amid ongoing market challenges.
Read full news article
KEC International Ltd Faces Bearish Momentum Amid Technical Downgrade
KEC International Ltd, a small-cap player in the construction sector, has experienced a notable shift in its technical momentum, prompting a downgrade in its Mojo Grade from Sell to Strong Sell as of 1 June 2026. The stock’s recent price action and technical indicators suggest increasing bearish pressure, raising concerns for investors amid a challenging market backdrop.
Read full news article Announcements
Announcement under Regulation 30 (LODR)-Analyst / Investor Meet - Intimation
28-May-2026 | Source : BSEPursuant to Regulation 30 read with Para A of Part A of Schedule III of the SEBI (Listing Obligations and Disclosure Requirements) Regulations 2015 the details of the Analyst/Institutional Investors meet to be attended by the Company are enclosed.
Compliances-Reg.24(A)-Annual Secretarial Compliance
27-May-2026 | Source : BSEPlease find enclosed the Annual Secretarial Compliance Report for the financial year ended March 31 2026 pursuant to regulation 24A of the SEBI (Listing Obligations and Disclosure Requirements)Regulations 2015 issued by M/s. Parikh Parekh & Associates Company Secretaries.
Announcement under Regulation 30 (LODR)-Newspaper Publication
27-May-2026 | Source : BSENotice to the shareholders intimating proposed transfer of equity shares of the Company to the Investor Education and Protection Fund Account.
Corporate Actions

No Upcoming Board Meetings

KEC International Ltd has declared 275% dividend, ex-date: 25 Jul 25

KEC International Ltd has announced 2:10 stock split, ex-date: 30 Dec 10

No Bonus history available

No Rights history available
Quality key factors
Valuation key factors
Technicals key factors
 Technical Indicator Scale: Bearish, Mildly Bearish, Sideways, Mildly Bullish, Bullish Turned
 Shareholding Snapshot : Mar 2026
Shareholding Compare (%holding)
Promoters
None
Held by 28 Schemes (24.13%)
Held by 159 FIIs (9.84%)
Swallow Associates Llp (25.45%)
Hdfc Mutual Fund - Hdfc Mid-cap Fund (6.95%)
10.36%
Quarterly Results Snapshot (Consolidated) - Mar'26 - YoY

YoY Growth in quarter ended Mar 2026 is -7.02% vs 11.47% in Mar 2025
YoY Growth in quarter ended Mar 2026 is -28.12% vs 76.74% in Mar 2025
Half Yearly Results Snapshot (Consolidated) - Sep'25

Growth in half year ended Sep 2025 is 15.47% vs 10.10% in Sep 2024
Growth in half year ended Sep 2025 is 64.96% vs 76.22% in Sep 2024
Nine Monthly Results Snapshot (Consolidated) - Dec'25
YoY Growth in nine months ended Dec 2025 is 14.30% vs 8.91% in Dec 2024
YoY Growth in nine months ended Dec 2025 is 36.44% vs 55.12% in Dec 2024
Annual Results Snapshot (Consolidated) - Mar'26
YoY Growth in year ended Mar 2026 is 7.59% vs 9.70% in Mar 2025
YoY Growth in year ended Mar 2026 is 6.11% vs 64.58% in Mar 2025
About KEC International Ltd

Company Coordinates


