
Compare KEI Industries with Similar Stocks
Dashboard
Low Debt Company with Strong Long Term Fundamental Strength
- Healthy long term growth as Net Sales has grown by an annual rate of 22.95% and Operating profit at 23.39%
- The company is Net-Debt Free
- The company has been able to generate a Return on Capital Employed (avg) of 25.30% signifying high profitability per unit of total capital (equity and debt)
The company has declared Positive results for the last 5 consecutive quarters
High Institutional Holdings at 53.1%
Market Beating performance in long term as well as near term
Stock DNA
Cables - Electricals
INR 51,768 Cr (Mid Cap)
58.00
50
0.08%
-0.19
13.78%
7.99
Total Returns (Price + Dividend) 
Latest dividend: 4.500116006290118 per share ex-dividend date: Jan-28-2026
Risk Adjusted Returns v/s
Returns Beta

News
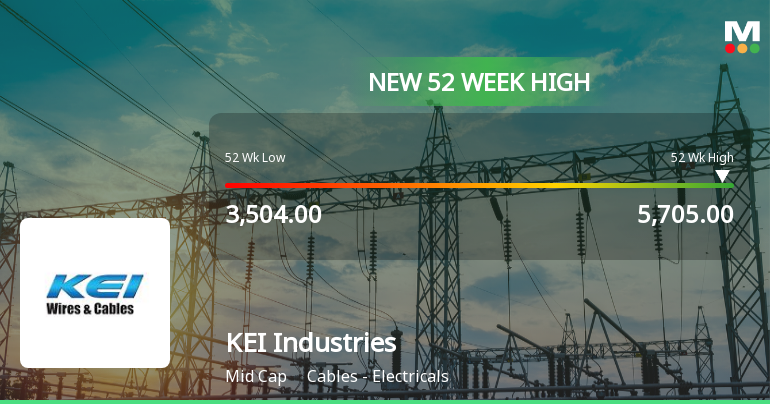
Broad-Based Technical Strength Lifts KEI Industries Ltd to 52-Week High of Rs 5690.95
Surging to a new 52-week and all-time high of Rs 5690.95 on 23 Jun 2026, KEI Industries Ltd has demonstrated remarkable price momentum, outpacing its sector and the broader market with a 51.26% gain over the past year against the Sensex’s decline of 5.81%.
Read full news article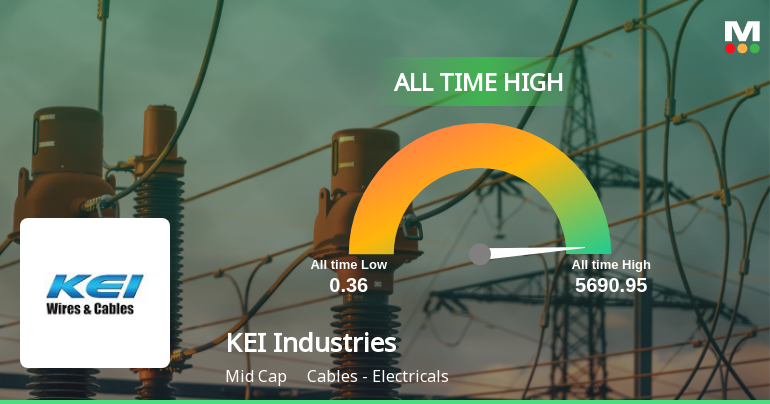
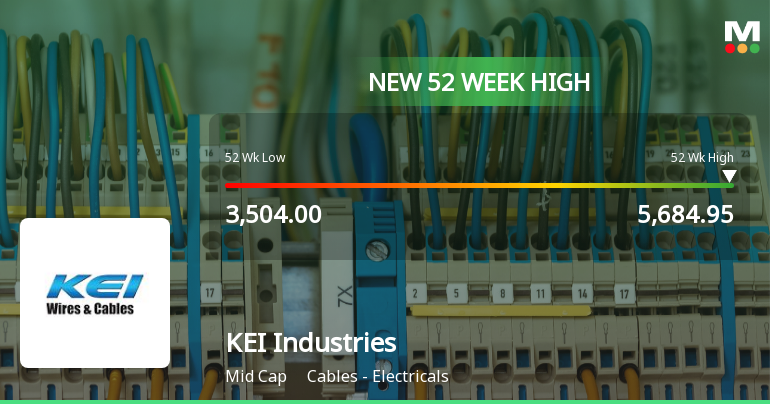
Broad-Based Technical Strength Lifts KEI Industries Ltd to 52-Week High of Rs 5684.95
Surging past its previous peaks, KEI Industries Ltd touched a new 52-week high of Rs 5684.95 on 22 Jun 2026, marking a remarkable 58.14% gain over the past year. This milestone comes amid a backdrop of strong technical momentum and sustained market outperformance.
Read full news article Announcements
Announcement under Regulation 30 (LODR)-Credit Rating
03-Jun-2026 | Source : BSEIntimation of Credit Rating(s) pursuant to Regulation 30 of SEBI (LODR) Regulations 2015.
Announcement under Regulation 30 (LODR)-Newspaper Publication
03-Jun-2026 | Source : BSEIntimation of newspaper publication- Special Window for Transfer and Dematerialisation of Physical Securities.
Announcement under Regulation 30 (LODR)-Change in Management
01-Jun-2026 | Source : BSEIntimation under Regulation 30 of the SEBI (Listing Obligations & Disclosures Requirements) Regulations 2015 - Change in Designation
Corporate Actions

No Upcoming Board Meetings

KEI Industries Ltd has declared 225% dividend, ex-date: 28 Jan 26

KEI Industries Ltd has announced 2:10 stock split, ex-date: 21 Dec 06

No Bonus history available

No Rights history available
Quality key factors
Valuation key factors
Technicals key factors
 Technical Indicator Scale: Bearish, Mildly Bearish, Sideways, Mildly Bullish, Bullish Turned
 Shareholding Snapshot : Mar 2026
Shareholding Compare (%holding)
Promoters
None
Held by 35 Schemes (22.43%)
Held by 338 FIIs (27.27%)
Anil Gupta (11.39%)
Motilal Oswal Bse 1000 Index Fund (4.56%)
9.73%
Quarterly Results Snapshot (Consolidated) - Mar'26 - YoY

YoY Growth in quarter ended Mar 2026 is 19.27% vs 25.11% in Mar 2025
YoY Growth in quarter ended Mar 2026 is 25.50% vs 34.46% in Mar 2025
Half Yearly Results Snapshot (Consolidated) - Sep'25

Growth in half year ended Sep 2025 is 22.25% vs 16.73% in Sep 2024
Growth in half year ended Sep 2025 is 30.88% vs 16.62% in Sep 2024
Nine Monthly Results Snapshot (Consolidated) - Dec'25
YoY Growth in nine months ended Dec 2025 is 21.26% vs 17.91% in Dec 2024
YoY Growth in nine months ended Dec 2025 is 34.96% vs 13.97% in Dec 2024
Annual Results Snapshot (Consolidated) - Mar'26
YoY Growth in year ended Mar 2026 is 20.66% vs 19.89% in Mar 2025
YoY Growth in year ended Mar 2026 is 31.88% vs 19.92% in Mar 2025
About KEI Industries Ltd

Company Coordinates


