
Compare Kellton Tech with Similar Stocks
Dashboard
Poor long term growth as Net Sales has grown by an annual rate of 9.43% and Operating profit at 4.82% over the last 5 years
- ROCE(HY) Lowest at 12.87%
- DEBTORS TURNOVER RATIO(HY) Lowest at 3.09 times
- OPERATING PROFIT TO INTEREST (Q) Lowest at 4.33 times
Despite the size of the company, domestic mutual funds hold only 0% of the company
Below par performance in long term as well as near term
Stock DNA
Computers - Software & Consulting
INR 831 Cr (Micro Cap)
9.00
20
0.00%
0.19
11.35%
1.00
Total Returns (Price + Dividend) 
Latest dividend: 0.25 per share ex-dividend date: Sep-16-2021
Risk Adjusted Returns v/s
Returns Beta

News

Kellton Tech Solutions Ltd is Rated Sell
Kellton Tech Solutions Ltd is rated Sell by MarketsMOJO, with this rating last updated on 01 June 2026. However, the analysis and financial metrics discussed here reflect the stock's current position as of 09 June 2026, providing investors with an up-to-date view of the company’s fundamentals, returns, and market performance.
Read full news article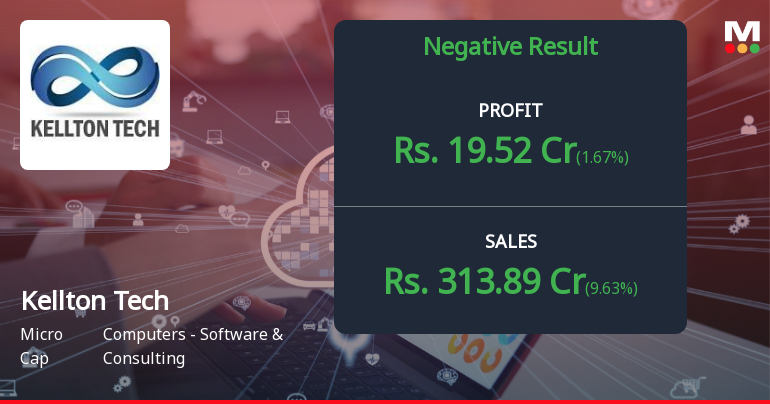
Kellton Tech Q4 FY26: Margin Compression Overshadows Revenue Growth
Kellton Tech Solutions Ltd., a global software services company specialising in digital transformation and IT consulting, reported mixed financial results for the quarter ended March 2026, with net profit declining sharply despite revenue reaching record levels. The company posted a consolidated net profit of ₹19.52 crores in Q4 FY26, down 23.18% quarter-on-quarter but up a modest 1.67% year-on-year, as margin pressures offset topline gains. The stock has reacted negatively, trading at ₹15.74 as of June 1, 2026, down 5.12% from its previous close and 38.75% lower over the past year.
Read full news article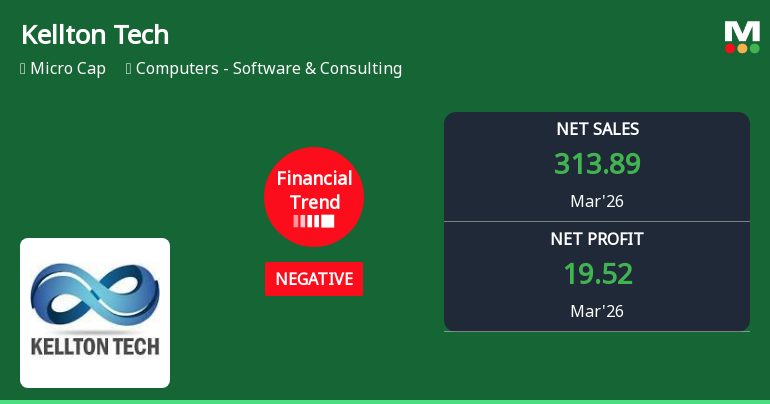
Kellton Tech Solutions Ltd Reports Decline in Quarterly Financial Performance Amid Revenue Growth
Kellton Tech Solutions Ltd, a micro-cap player in the Computers - Software & Consulting sector, has reported a mixed quarterly performance for March 2026. While net sales reached an all-time high of ₹313.89 crores, key profitability metrics deteriorated sharply, signalling a shift from positive to negative financial trends. The company’s Mojo Grade was downgraded from Hold to Sell on 25 May 2026, reflecting growing concerns over margin contraction and earnings pressure.
Read full news article Announcements
Announcement under Regulation 30 (LODR)-Earnings Call Transcript
03-Jun-2026 | Source : BSETranscript of Earnings Call held on June 01 2026
Announcement under Regulation 30 (LODR)-Newspaper Publication
02-Jun-2026 | Source : BSENewspaper Publication
Announcement under Regulation 30 (LODR)-Newspaper Publication
02-Jun-2026 | Source : BSECopy of Newspaper Publication
Corporate Actions

No Upcoming Board Meetings

Kellton Tech Solutions Ltd has declared 5% dividend, ex-date: 16 Sep 21

Kellton Tech Solutions Ltd has announced 1:5 stock split, ex-date: 25 Jul 25

Kellton Tech Solutions Ltd has announced 1:1 bonus issue, ex-date: 27 Mar 18

No Rights history available
Quality key factors
Valuation key factors
Technicals key factors
 Technical Indicator Scale: Bearish, Mildly Bearish, Sideways, Mildly Bullish, Bullish Turned
 Shareholding Snapshot : Mar 2026
Shareholding Compare (%holding)
Non Institution
15.1833
Held by 0 Schemes
Held by 32 FIIs (1.04%)
Matnic Finvest Llp (32.98%)
None
53.53%
Quarterly Results Snapshot (Consolidated) - Mar'26 - YoY

YoY Growth in quarter ended Mar 2026 is 9.63% vs 15.53% in Mar 2025

YoY Growth in quarter ended Mar 2026 is 1.67% vs -19.77% in Mar 2025
Half Yearly Results Snapshot (Consolidated) - Sep'25
Growth in half year ended Sep 2025 is 11.74% vs 8.78% in Sep 2024
Growth in half year ended Sep 2025 is 18.01% vs 23.94% in Sep 2024
Nine Monthly Results Snapshot (Consolidated) - Dec'25
YoY Growth in nine months ended Dec 2025 is 11.28% vs 10.40% in Dec 2024
YoY Growth in nine months ended Dec 2025 is 19.20% vs 51.00% in Dec 2024
Annual Results Snapshot (Consolidated) - Mar'26
YoY Growth in year ended Mar 2026 is 10.85% vs 11.69% in Mar 2025
YoY Growth in year ended Mar 2026 is 14.98% vs 24.54% in Mar 2025
About Kellton Tech Solutions Ltd

Company Coordinates


