
Compare Kennametal India with Similar Stocks
Stock DNA
Industrial Manufacturing
INR 6,570 Cr (Small Cap)
48.00
37
1.35%
-0.22
18.53%
8.69
Total Returns (Price + Dividend) 
Latest dividend: 40 per share ex-dividend date: May-15-2026
Risk Adjusted Returns v/s
Returns Beta

News
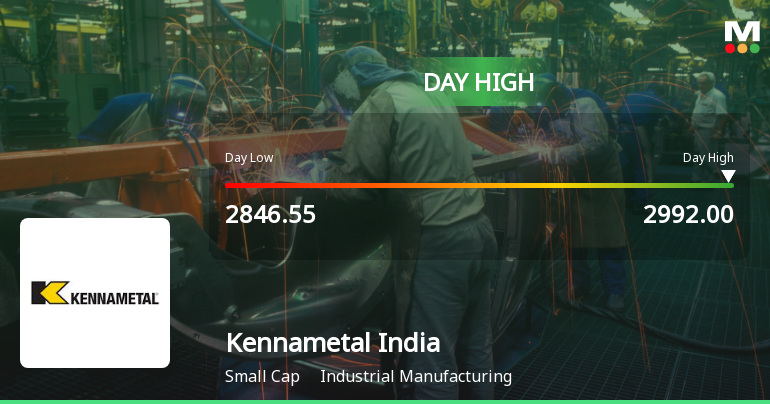
Kennametal India Ltd Surges 7.31% to Day's High of Rs 2976.95 — Outperforms Sector by 4.48 Percentage Points
The Sensex advanced 1.32% on 15 Jun 2026, yet Kennametal India Ltd outpaced the broader market with a 7.31% gain, touching an intraday high of Rs 2976.95. This 4.48-percentage-point outperformance over the Engineering sector’s 2.55% rise signals a distinctly stock-specific rally rather than a mere market tailwind.
Read full news article
Kennametal India Ltd is Rated Buy
Kennametal India Ltd is rated 'Buy' by MarketsMOJO, with this rating last updated on 07 May 2026. However, the analysis and financial metrics discussed here reflect the stock's current position as of 15 June 2026, providing investors with the most up-to-date view of the company’s performance and outlook.
Read full news article
Kennametal India Ltd is Rated Buy by MarketsMOJO
Kennametal India Ltd is rated 'Buy' by MarketsMOJO, with this rating last updated on 07 May 2026. However, the analysis and financial metrics discussed here reflect the stock's current position as of 04 June 2026, providing investors with the most up-to-date insight into the company’s performance and outlook.
Read full news article Announcements
Closure of Trading Window
12-Jun-2026 | Source : BSEThe Trading Window of Kennametal India Limited will be closed from 16 June 2026 until completion of 48 hours after declaration of the audited financial results of the Company for the fourth quarter and year ending 30 June 2026.
Announcement under Regulation 30 (LODR)-Newspaper Publication
23-May-2026 | Source : BSEPlease find enclosed a copy of newspaper advertisement regarding Notice of Postal Ballot and remote E-voting information
Shareholder Meeting / Postal Ballot-Notice of Postal Ballot
22-May-2026 | Source : BSEPlease find enclosed the copy of Postal Ballot Notice dated May 7 2026
Corporate Actions

No Upcoming Board Meetings

Kennametal India Ltd has declared 400% dividend, ex-date: 15 May 26

No Splits history available

No Bonus history available

No Rights history available
Quality key factors
Valuation key factors
Technicals key factors
 Technical Indicator Scale: Bearish, Mildly Bearish, Sideways, Mildly Bullish, Bullish Turned
 Shareholding Snapshot : Mar 2026
Shareholding Compare (%holding)
Promoters
None
Held by 8 Schemes (13.97%)
Held by 35 FIIs (0.35%)
Meturit Ag (51.0%)
Nippon Life India Trustee Ltd-a/c Nippon India Multi Cap Fund (8.89%)
8.78%
Quarterly Results Snapshot (Standalone) - Mar'26 - YoY

YoY Growth in quarter ended Mar 2026 is 39.19% vs 7.74% in Mar 2025
YoY Growth in quarter ended Mar 2026 is 110.66% vs -36.29% in Mar 2025
Half Yearly Results Snapshot (Standalone) - Dec'25
Growth in half year ended Dec 2025 is 13.02% vs 5.43% in Dec 2024
Growth in half year ended Dec 2025 is 18.22% vs 12.38% in Dec 2024
Nine Monthly Results Snapshot (Standalone) - Mar'26
YoY Growth in nine months ended Mar 2026 is 21.97% vs 6.21% in Mar 2025
YoY Growth in nine months ended Mar 2026 is 49.72% vs -10.83% in Mar 2025
Annual Results Snapshot (Standalone) - Jun'25
YoY Growth in year ended Jun 2025 is 6.40% vs 2.12% in Jun 2024

YoY Growth in year ended Jun 2025 is -6.88% vs 26.00% in Jun 2024
About Kennametal India Ltd

Company Coordinates


