
Compare Kenvi Jewels with Similar Stocks
Dashboard
Weak Long Term Fundamental Strength with an average Return on Capital Employed (ROCE) of 8.10%
- Company's ability to service its debt is weak with a poor EBIT to Interest (avg) ratio of 1.71
- NET SALES(Q) At Rs 49.50 cr has Fallen at -10.42%
- PBDIT(Q) Lowest at Rs 0.29 cr.
- OPERATING PROFIT TO NET SALES (Q) Lowest at 0.59%
Consistent Underperformance against the benchmark over the last 3 years
Stock DNA
Gems, Jewellery And Watches
INR 28 Cr (Micro Cap)
33.00
46
0.00%
0.80
5.34%
1.73
Total Returns (Price + Dividend) 
Kenvi Jewels for the last several years.
Risk Adjusted Returns v/s
Returns Beta

News
Are Kenvi Jewels Ltd latest results good or bad?
Kenvi Jewels Ltd's latest financial results for the fourth quarter of FY26 reveal significant operational challenges. The company reported a net loss of ₹0.17 crores, marking its first loss in the available data series, in stark contrast to a profit of ₹0.14 crores in the same quarter last year. This shift indicates a substantial decline in profitability, raising concerns about the sustainability of its business model. Revenue for the quarter stood at ₹49.50 crores, reflecting a year-on-year decline of 10.42% from ₹55.26 crores in Q4 FY25. Additionally, the revenue decreased sequentially by 6.34% from ₹52.85 crores in the previous quarter, highlighting a troubling trend of decreasing sales momentum as the fiscal year concluded. Operating margins also faced significant pressure, dropping to 0.59%, the lowest level in seven quarters, compared to 1.28% in Q4 FY25. This margin compression suggests challenges ...
Read full news article
Kenvi Jewels Ltd Reports Sharp Decline in Quarterly Financial Performance Amid Negative Trend Shift
Kenvi Jewels Ltd, a micro-cap player in the Gems, Jewellery and Watches sector, has reported a marked deterioration in its financial performance for the quarter ended March 2026. The company’s financial trend score plunged from a positive 9 to a negative -6 over the last three months, signalling a significant reversal in growth momentum and profitability metrics.
Read full news article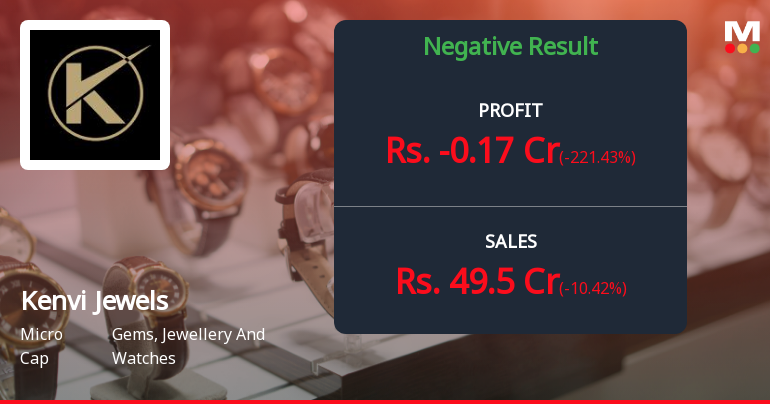
Kenvi Jewels Q4 FY26: Losses Mount as Margins Collapse Amid Revenue Decline
Kenvi Jewels Ltd., an Ahmedabad-based gems and jewellery manufacturer, reported a net loss of ₹0.17 crores for the quarter ended March 2026, marking a sharp reversal from the ₹0.14 crores profit recorded in the corresponding quarter of the previous year. The company's shares, trading at ₹2.13 on the National Stock Exchange as of June 1, 2026, have declined 0.47% in the latest trading session, reflecting investor concerns over deteriorating operational performance and profitability metrics.
Read full news article Announcements
Announcement under Regulation 30 (LODR)-Newspaper Publication
01-Jun-2026 | Source : BSENewspaper Advertisement of the Audited Financial Results of the Company for the FY ended 31.03.2026
Compliances-Reg.24(A)-Annual Secretarial Compliance
30-May-2026 | Source : BSEASCR of the Company for the Financial Year ended 31.03.2026
Board Meeting Outcome for Audited Financial Results
30-May-2026 | Source : BSEAudited Financial Results of the Company for the Financial Year ended 31.03.2026
Corporate Actions

No Upcoming Board Meetings

No Dividend history available

Kenvi Jewels Ltd has announced 1:10 stock split, ex-date: 19 May 23

Kenvi Jewels Ltd has announced 1:4 bonus issue, ex-date: 19 May 23

No Rights history available
Quality key factors
Valuation key factors
Technicals key factors
 Technical Indicator Scale: Bearish, Mildly Bearish, Sideways, Mildly Bullish, Bullish Turned
 Shareholding Snapshot : Mar 2026
Shareholding Compare (%holding)
Promoters
None
Held by 0 Schemes
Held by 0 FIIs
Chirag Champaklal Valani (50.1%)
Vivid Mercantile Limited (6.41%)
33.25%
Quarterly Results Snapshot (Standalone) - Mar'26 - YoY

YoY Growth in quarter ended Mar 2026 is -10.42% vs 72.31% in Mar 2025
YoY Growth in quarter ended Mar 2026 is -221.43% vs 27.27% in Mar 2025
Half Yearly Results Snapshot (Standalone) - Sep'25

Growth in half year ended Sep 2025 is 28.36% vs 12.47% in Sep 2024
Growth in half year ended Sep 2025 is 69.70% vs 10.00% in Sep 2024
Nine Monthly Results Snapshot (Standalone) - Dec'25
YoY Growth in nine months ended Dec 2025 is 21.48% vs -25.13% in Dec 2024
YoY Growth in nine months ended Dec 2025 is 64.52% vs -27.91% in Dec 2024
Annual Results Snapshot (Standalone) - Mar'26
YoY Growth in year ended Mar 2026 is 10.61% vs 33.39% in Mar 2025
YoY Growth in year ended Mar 2026 is 13.33% vs 13.64% in Mar 2025
About Kenvi Jewels Ltd

Company Coordinates


