
Compare Kerala Ayurveda with Similar Stocks
Dashboard
With HIgh Debt (Debt-Equity Ratio at 7.26 times)- the company has a Weak Long Term Fundamental Strength
- Poor long term growth as Operating profit has grown by an annual rate -210.97% of over the last 5 years
- High Debt Company with a Debt to Equity ratio (avg) of 10.88 times
- The company has been able to generate a Return on Capital Employed (avg) of 6.09% signifying low profitability per unit of total capital (equity and debt)
The company has declared Negative results for the last 5 consecutive quarters
Risky - Negative EBITDA
Stock DNA
Pharmaceuticals & Biotechnology
INR 220 Cr (Micro Cap)
NA (Loss Making)
33
0.00%
7.26
-148.92%
19.77
Total Returns (Price + Dividend) 
Kerala Ayurveda for the last several years.
Risk Adjusted Returns v/s
Returns Beta

News

Kerala Ayurveda Ltd is Rated Strong Sell
Kerala Ayurveda Ltd is rated Strong Sell by MarketsMOJO, with this rating last updated on 11 Aug 2025. However, the analysis and financial metrics discussed here reflect the company’s current position as of 29 May 2026, providing investors with an up-to-date view of the stock’s fundamentals, returns, and technical outlook.
Read full news articleAre Kerala Ayurveda Ltd latest results good or bad?
The latest financial results for Kerala Ayurveda Ltd reveal a complex picture of revenue growth juxtaposed with significant operational challenges. In Q4 FY26, the company reported net sales of ₹34.74 crores, reflecting a year-on-year growth of 10.92% and a quarter-on-quarter increase of 5.40%. This growth indicates some market traction for its ayurvedic product offerings. However, despite this revenue growth, the company faced a consolidated net loss of ₹7.76 crores, which represents a widening of losses both sequentially and year-on-year. The operational metrics show that the operating margin, excluding other income, was at -20.44%, which, while an improvement from the previous year’s -32.38%, still indicates substantial operational distress. The profit after tax (PAT) margin also remained negative at -21.30%, although it improved from -49.07% in the same quarter last year. This suggests that while the c...
Read full news article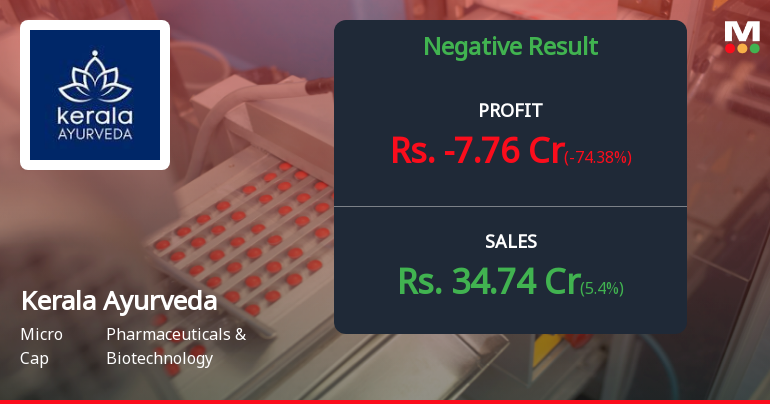
Kerala Ayurveda Q4 FY26: Losses Deepen as Operational Crisis Intensifies
Kerala Ayurveda Ltd., the speciality ayurvedic medicines manufacturer, reported a consolidated net loss of ₹7.76 crores for Q4 FY26, marking a deterioration of 74.38% quarter-on-quarter and a staggering 50.06% decline year-on-year. The company, with a market capitalisation of ₹272.00 crores, continues to grapple with severe operational challenges that have eroded profitability despite modest revenue growth. Shares have plummeted 48.15% over the past year, trading at ₹211.00 as investors flee amidst mounting concerns about the company's financial viability.
Read full news article Announcements
Compliances-Reg.24(A)-Annual Secretarial Compliance
30-May-2026 | Source : BSEASCR 2026
Announcement under Regulation 30 (LODR)-Newspaper Publication
27-May-2026 | Source : BSENewspaper publication - Financial Results
Results - Financial Results For The Year Ended 31St March 2026
25-May-2026 | Source : BSEFinancial Results for the Year Ended 31st March 2026
Corporate Actions

No Upcoming Board Meetings

No Dividend history available

No Splits history available

No Bonus history available

No Rights history available
Quality key factors
Valuation key factors
Technicals key factors
 Technical Indicator Scale: Bearish, Mildly Bearish, Sideways, Mildly Bullish, Bullish Turned
 Shareholding Snapshot : Mar 2026
Shareholding Compare (%holding)
Non Institution
20.3515
Held by 1 Schemes (0.02%)
Held by 1 FIIs (0.17%)
Katra Holdings Ltd (30.75%)
Porinju Veliyath (3.49%)
42.16%
Quarterly Results Snapshot (Consolidated) - Mar'26 - QoQ

QoQ Growth in quarter ended Mar 2026 is 5.40% vs -5.40% in Dec 2025

QoQ Growth in quarter ended Mar 2026 is -74.38% vs 29.81% in Dec 2025
Half Yearly Results Snapshot (Consolidated) - Sep'25
Growth in half year ended Sep 2025 is 9.60% vs 18.38% in Sep 2024
Growth in half year ended Sep 2025 is -216.31% vs 863.27% in Sep 2024
Nine Monthly Results Snapshot (Consolidated) - Dec'25
YoY Growth in nine months ended Dec 2025 is 8.30% vs 18.35% in Dec 2024
YoY Growth in nine months ended Dec 2025 is -1,135.29% vs 157.05% in Dec 2024
Annual Results Snapshot (Consolidated) - Mar'26
YoY Growth in year ended Mar 2026 is 8.99% vs 16.66% in Mar 2025
YoY Growth in year ended Mar 2026 is -12.65% vs -1,104.92% in Mar 2025
About Kerala Ayurveda Ltd

Company Coordinates


