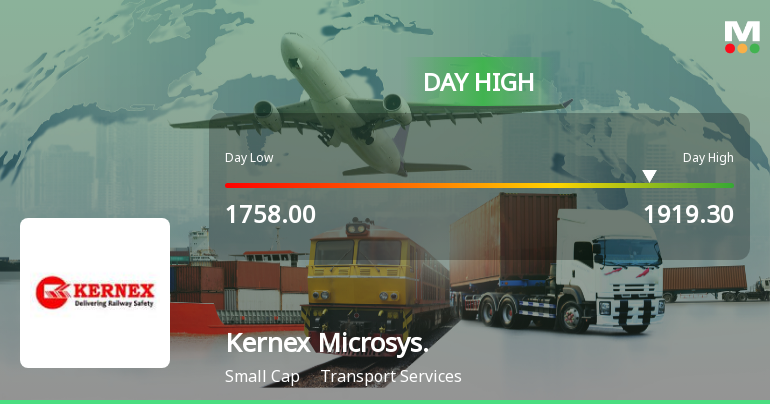
Kernex Microsys.

  • Market Cap: Small Cap
  • Industry: Transport Services
  • ISIN: INE202H01019
  • NSEID: KERNEX
  • BSEID: 532686
INR
1,899.40
-67.4 (-3.43%)
BSENSE

Aug 25, 03:30 PM

BSE+NSE Vol: 1.77 lacs

  • Price Points
  • Score
  • Mojo Parameters
  • Total Return
  • News and Corporate Actions
  • Key factors
  • Shareholding
  • Financials
  • CompanyCV
stock-summaryPrice Point
High/Low

1Day

52 Week

Valuation
Technical
Day's Volume

CASH

1.77 lacs (-46.29%) Volume

Shareholding (Jun 2026)

FII

2.48%

Held by 10 FIIs

DII

0.11%

Held by 0 DIIs

Promoter

28.73%

Why is Kernex Microsystems (India) Ltd falling/rising?

25-Aug-2026

As of 24-Aug, Kernex Microsystems (India) Ltd's stock price has risen to 1,970.70, reflecting a 1.84% increase due to strong financial performance, positive investor sentiment, and increased institutional investment. The company has shown significant growth in sales and profits, contributing to its attractiveness as an investment option.

As of 24-Aug, Kernex Microsystems (India) Ltd is experiencing a rise in its stock price, currently at 1,970.70, reflecting an increase of 35.7 (1.84%). This upward movement can be attributed to several positive factors. The stock has outperformed the sector by 1.77% today and has shown consecutive gains over the last two days, accumulating a total return of 7.29% during this period. Additionally, the stock reached an intraday high of Rs 2007.7, indicating strong investor interest.<BR><BR>The company's financial performance has also been robust, with net sales growing at an annual rate of 114.31% and operating profit increasing by 211.26%. The positive results from the last two consecutive quarters, along with a significant growth in profit before tax (PBT) of 414.5% compared to the previous four-quarter average, further bolster investor confidence. The return on capital employed (ROCE) is notably high at 35.39%, and the stock is trading at a discount relative to its peers' historical valuations, making it an attractive investment option.<BR><BR>Moreover, there has been an increase in participation from institutional investors, who have raised their stake by 2.21% in the previous quarter, indicating a growing confidence in the company's fundamentals. The stock's consistent performance over the past three years, with an impressive return of 85.71% in the last year alone, has also contributed to its rising price. Overall, the combination of strong financial results, positive investor sentiment, and institutional interest has led to the current rise in the stock price of Kernex Microsystems (India) Ltd.

View full answer

Should I buy, sell or hold Kernex Microsystems (India) Ltd?

18-Aug-2026

Who are in the management team of Kernex Microsys.?

14-Aug-2026

The management team of Kernex Microsys includes Anji Raju, Janardhana Reddy Vinta, M B Narayana Raju, Sree Lakshmi Manthena, Prasada Rao Kalluri, Sreenivasa Rao Ravinuthala, Soma Sekhara Rao Koganti, Sitarama Raju Manthena, and A V S Krishna Mohan, who oversee the company's operations and strategic direction.

The management team of Kernex Microsys includes the following individuals:<BR><BR>1. Anji Raju - Director<BR>2. Janardhana Reddy Vinta - Director<BR>3. M B Narayana Raju - Whole-time Director<BR>4. Sree Lakshmi Manthena - Director<BR>5. Prasada Rao Kalluri - Company Secretary & Compliance Officer<BR>6. Sreenivasa Rao Ravinuthala - Chairman & Independent Director<BR>7. Soma Sekhara Rao Koganti - Independent Director<BR>8. Sitarama Raju Manthena - Whole-time Director<BR>9. A V S Krishna Mohan - Independent Director<BR><BR>This team is responsible for overseeing the company's operations and strategic direction.

View full answer

What does Kernex Microsys. do?

14-Aug-2026

Kernex Microsystems (India) Ltd is a software development and consultancy company in the Transport Services industry, with a market cap of INR 3,818 Cr and reported net sales of 504 Cr and net profit of 110 Cr for June 2026. The company, incorporated in 1991, operates as a 100% Export Oriented Unit.

Overview:<BR>Kernex Microsystems (India) Ltd is a software development and consultancy company operating in the Transport Services industry and classified as a Small Cap entity.<BR><BR>History:<BR>The company was incorporated on September 16, 1991, and is registered as a 100% Export Oriented Unit with the Software Technology Parks of India. The latest quarterly results reported net sales and profit for June 2026.<BR><BR>Financial Snapshot:<BR>- Net Sales: 504 Cr (Quarterly Results - Jun 2026)<BR>- Net Profit: 110 Cr (Quarterly Results - Jun 2026)<BR>- Market cap: INR 3,818 Cr (Small Cap)<BR><BR>Key Metrics:<BR>- P/E: 20.00<BR>- Industry P/E: 22<BR>- Dividend Yield: 0.00%<BR>- Debt Equity: 0.54<BR>- Return on Equity: 35.60%<BR>- Price to Book: 14.81<BR><BR>Contact Details:<BR>- Address: No 38 to 41 Sy No 1/1 M Mandal, Hardware Park Raviryal Village Hyderabad Telangana : 501510<BR>- Tel: 91-9948488877<BR>- Email: md@kernex.in / acs@kernex.in<BR>- Website: http://www.kernex.in

View full answer

Who are the peers of the Kernex Microsys.?

14-Aug-2026

Kernex Microsys. peers include TVS Supply, VRL Logistics, Afcom Holdings, Mahindra Logistics, SEAMEC Ltd, Gateway Distri, TCI Express, Allcargo Logistics, and Navkar Corporation. Kernex Microsys. shows good management risk and excellent growth, with a 1-year return of 91.95%, outperforming its peers.

Peers: The peers of Kernex Microsys. are TVS Supply, VRL Logistics, Afcom Holdings, Mahindra Logis., SEAMEC Ltd, Gateway Distri, TCI Express, Allcargo Logist., and Navkar Corporat.<BR><BR>Quality Snapshot: Excellent management risk is observed at Afcom Holdings and Gateway Distri, while Good management risk is found at VRL Logistics, TCI Express, and Kernex Microsys. Average management risk is present at Mahindra Logis., Allcargo Logist., and the rest. For Growth, Excellent growth is noted at Afcom Holdings and Kernex Microsys., while Average growth is found at TVS Supply, Mahindra Logis., and the rest. Below Average growth is observed at VRL Logistics, Gateway Distri, TCI Express, Allcargo Logist., Navkar Corporat., and the rest. In terms of Capital Structure, Excellent capital structure is seen at TCI Express and Afcom Holdings, while Good capital structure is noted at Gateway Distri and SEAMEC Ltd. Average capital structure is present at Kernex Microsys., Mahindra Logis., Allcargo Logist., and the rest, while Below Average capital structure is found at TVS Supply and Navkar Corporat.<BR><BR>Return Snapshot: The peer with the highest 1-year return is Afcom Holdings at 68.99%, while the lowest is Navkar Corporat. at -18.28%. Kernex Microsys. has a 1-year return of 91.95%, which is significantly higher than both extremes. Additionally, peers with negative six-month returns include TVS Supply, Gateway Distri, TCI Express, and Navkar Corporat.

View full answer

How big is Kernex Microsys.?

14-Aug-2026

As of 14th August, Kernex Microsystems (India) Ltd has a market capitalization of 3,365.43 Cr, with recent net sales of 877.88 Cr and a net profit of 190.72 Cr.

As of 14th August, Kernex Microsystems (India) Ltd has a market capitalization of 3,365.43 Cr, categorizing it as a Small Cap company.<BR><BR>In the latest four quarters, Kernex Microsystems reported Net Sales of 877.88 Cr and a Net Profit of 190.72 Cr.<BR><BR>The latest annual period for the balance sheet is March 2025, where Shareholder's Funds are valued at 157.91 Cr and Total Assets amount to 218.76 Cr.

View full answer

Are Kernex Microsystems (India) Ltd latest results good or bad?

30-May-2026

Kernex Microsystems (India) Ltd's latest results show impressive growth, with record revenue and net profit increases; however, the volatility in revenue and rising interest expenses raise concerns about sustainability, suggesting investors should proceed with caution.

Kernex Microsystems (India) Ltd's latest results present a mixed picture. On one hand, the company achieved its highest-ever quarterly revenue of ₹254.58 crores, reflecting a remarkable 250.66% growth compared to the previous quarter. Additionally, net profit soared to ₹68.26 crores, marking an astonishing increase of 1,030.13% quarter-on-quarter. The operating margin also reached an all-time high of 41.29%.<BR><BR>However, these impressive figures come with significant caveats. The revenue growth appears to be quite volatile, with previous quarters showing substantial fluctuations, raising concerns about the sustainability of this performance. The dramatic increase in interest expenses, which hit ₹11.79 crores, the highest on record, further complicates the outlook. <BR><BR>While the year-on-year comparisons are also strong, with net profit up 109.45% and revenue advancing 206.46% compared to the same quarter last year, the erratic nature of quarterly results suggests that investors should approach these numbers with caution. The company’s historical return ratios have been weak, and the recent improvements, while notable, need to be validated over the coming quarters.<BR><BR>In summary, while the latest results are impressive on the surface, the underlying volatility and operational challenges suggest that investors should remain vigilant and consider the sustainability of this growth before making any decisions.

View full answer

When is the next results date for Kernex Microsystems (India) Ltd?

10-Feb-2026

The next results date for Kernex Microsystems (India) Ltd is 12 February 2026.

The next results date for Kernex Microsystems (India) Ltd is scheduled for 12 February 2026.

View full answer

Is Kernex Microsys. overvalued or undervalued?

05-Dec-2025

As of December 4, 2025, Kernex Microsys is considered overvalued at a price of 1,038.15, with a PE ratio of 32.34 and lagging stock performance, especially compared to peers like TCS and Infosys, which have more attractive valuation metrics.

As of 4 December 2025, the valuation grade for Kernex Microsys has moved from very expensive to expensive. The company appears to be overvalued at its current price of 1,038.15, especially when considering its PE ratio of 32.34, an EV to EBIT of 36.52, and a Price to Book Value of 10.01. These ratios indicate that the stock is trading at a premium compared to its earnings and book value.<BR><BR>In comparison to its peers, TCS has a more attractive PE ratio of 23.23 and EV to EBITDA of 16.35, while Infosys shows a PE ratio of 23.6 and EV to EBITDA of 15.52. These figures suggest that Kernex Microsys is priced significantly higher than its more reasonably valued competitors. Additionally, the company's recent stock performance has lagged behind the Sensex, with a year-to-date return of -22.87% compared to the Sensex's positive return of 9.12%, reinforcing the notion that the stock may be overvalued.

View full answer

Is Kernex Microsys. technically bullish or bearish?

25-Nov-2025

As of November 24, 2025, the market trend is mildly bullish due to positive signals from the MACD and moving averages, but caution is advised due to mixed signals from the Dow Theory and KST indicators.

As of 24 November 2025, the technical trend has changed from bullish to mildly bullish. The current stance is mildly bullish, driven by the weekly MACD and KST indicators showing bullish signals, while the moving averages on the daily timeframe also indicate a mildly bullish trend. However, the Dow Theory suggests a mildly bearish outlook on the weekly timeframe, which adds some caution. The Bollinger Bands are also mildly bullish on both weekly and monthly timeframes. Overall, the strength of the bullish stance is tempered by mixed signals from the KST and Dow Theory, indicating a cautious approach may be warranted.

View full answer

How has been the historical performance of Kernex Microsys.?

13-Nov-2025

Kernex Microsys has shown significant growth, with net sales increasing from 4.04 Cr in March 2023 to 189.77 Cr in March 2025, and operating profit turning positive at 42.25 Cr. The company has recovered from previous losses, with profit after tax reaching 50.05 Cr and total assets growing to 218.76 Cr.

Answer:<BR>The historical performance of Kernex Microsys shows significant fluctuations over the years, with a notable increase in net sales and profitability in the most recent fiscal year.<BR><BR>Breakdown:<BR>Kernex Microsys experienced a remarkable surge in net sales, rising from 4.04 Cr in March 2023 to 189.77 Cr in March 2025, marking a substantial growth trend. Total operating income followed suit, increasing to 189.77 Cr in March 2025 from just 4.04 Cr in March 2023. The company's total expenditure also rose, reaching 148.97 Cr in March 2025, primarily driven by raw material costs which increased to 94.25 Cr. Operating profit, which had been negative in previous years, turned positive at 42.25 Cr in March 2025, showcasing a significant recovery. Profit before tax also improved dramatically to 32.51 Cr, while profit after tax reached 50.05 Cr, a stark contrast to the losses recorded in prior years. The company's total assets grew to 218.76 Cr in March 2025, up from 101.60 Cr in March 2023, and total liabilities increased to 40.32 Cr, indicating a rise in borrowing. Cash flow from operating activities turned positive at 14.00 Cr in March 2025, reflecting improved operational efficiency. Overall, Kernex Microsys has shown a strong recovery and growth trajectory in its latest financial results.

View full answer

Who are the top shareholders of the Kernex Microsys.?

17-Jul-2025

The top shareholder of Kernex Microsys is Anji Raju Manthena, holding 14.84%. Individual investors collectively own 47.13%, while Capgro Private Limited holds 3.58%, and mutual funds and foreign institutional investors have minor stakes.

The top shareholders of Kernex Microsys include Anji Raju Manthena, who is the promoter with the highest holding at 14.84%. The company also has significant individual investor holdings, accounting for 47.13%. In terms of public shareholders, Capgro Private Limited holds 3.58%. Additionally, there are mutual funds involved, with 1 scheme holding 1.09%, and 5 foreign institutional investors (FIIs) holding 0.07%. The majority of the shareholding is held by non-institutional investors.

View full answer

What is the bonus history of the Kernex Microsys.?

06-Jun-2025

Kernex Microsys issued a 1:10 bonus on October 16, 2007, with a record date of October 17, 2007, meaning shareholders received one additional share for every ten shares held.

Kernex Microsys has a bonus history that includes a 1:10 bonus issue announced on October 16, 2007. The record date for this bonus was October 17, 2007. This means that for every 10 shares held, shareholders received an additional share as a bonus.

View full answer

Has Kernex Microsys. declared dividend?

06-Jun-2025

Kernex Microsystems has declared a 10% dividend, amounting to ₹1 per share, with an ex-date of September 20, 2012. Despite the dividend declaration, the yield is 0%, as recent returns have been driven solely by significant price appreciation.

Kernex Microsystems (India) Ltd has declared a 10% dividend.<BR><BR>Dividend Details:<BR>- Percentage announced: 10%<BR>- Amount per share: 1 per share<BR>- Ex-date: 20 Sep 12<BR><BR>Dividend Yield: 0%<BR><BR>Total Returns by Period:<BR>In the 6 months period, the price return was 8.79%, the dividend return was 0%, resulting in a total return of 8.79%.<BR><BR>In the 1 year period, the price return was 225.18%, the dividend return was 0%, resulting in a total return of 225.18%.<BR><BR>In the 2 years period, the price return was 297.06%, the dividend return was 0%, resulting in a total return of 297.06%.<BR><BR>In the 3 years period, the price return was 559.26%, the dividend return was 0%, resulting in a total return of 559.26%.<BR><BR>In the 4 years period, the price return was 2405.86%, the dividend return was 0%, resulting in a total return of 2405.86%.<BR><BR>In the 5 years period, the price return was 8823.74%, the dividend return was 0%, resulting in a total return of 8823.74%.<BR><BR>Overall, while Kernex Microsystems has declared a dividend, the dividend yield remains at 0%, indicating that the dividend did not contribute to returns in recent years. However, the price returns over the periods show significant growth, reflecting strong performance in the stock price.

View full answer
iScoreScore
Click here to find our call on this stock
Strong Sell
Sell
Hold
Buy
Strong Buy

Dashboard

1

Healthy long term growth as Net Sales has grown by an annual rate of 114.31% and Operating profit at 211.26%

 
2

With a growth in Net Sales of 97.81%, the company declared Outstanding results in Jun 26

3

With ROCE of 37.3, it has a Fair valuation with a 8.7 Enterprise value to Capital Employed

4

Increasing Participation by Institutional Investors

5

Consistent Returns over the last 3 years

stock-summaryMojo Parameters

Mojo Parameters

Loading Valuation Snapshot...

Stock DNA

stock-summary
Industry

Transport Services

stock-summary
Market cap

INR 3,206 Cr (Small Cap)

stock-summary
P/E

17.00

stock-summary
Industry P/E

21

stock-summary
Dividend Yield

0.00%

stock-summary
Debt Equity

0.54

stock-summary
Return on Equity

35.60%

stock-summary
Price to Book

13.35

Revenue and Profits:
Net Sales:
504 Cr
(Quarterly Results - Jun 2026)
Net Profit:
110 Cr
stock-summaryTotal Returns
Total Returns (Price + Dividend) stock-summary
Dividend Yield (0%)
TimePeriod
Price Return
Dividend Return
Total Return
3 Months
29.74%
0%
29.74%
6 Months
75.33%
0%
75.33%
1 Year
81.03%
0%
81.03%
2 Years
97.92%
0%
97.92%
3 Years
358.4%
0%
358.4%
4 Years
702.79%
0%
702.79%
5 Years
2530.75%
0%
2530.75%

Latest dividend: 1 per share ex-dividend date: Sep-20-2012

Risk Adjusted Returns v/s stock-summary
Returns Beta
Icon
Beta has not been calculated since enough price history is not available
stock-summaryNews & Corporate Actions

News

Announcements stock-summary

Kernex Microsystems (India) Limited - Updates

15-Nov-2019 | Source : NSE

Kernex Microsystems (India) Limited has informed the Exchange regarding 'Disclosure under Regulation 30 of the Securities and Exchange Board of India (Listing Obligations and Disclosure Requirements) Regulations, 2015'.

Kernex Microsystems (India) Limited - Reply to Clarification Sought

30-Oct-2019 | Source : NSE

Kernex Microsystems (India) Limited (India) Limited with respect to announcement dated 12-Oct-2019, regarding resignation of Mr Dinakara Rao Pasupuleti as Non- Executive Independent Director of the company w.e.f. October 12, 2019. On basis of above the Company was required to clarify following: 1. Confirmation from the resigning director that there is no other material reasons other than provided.The response of the Company is attached.

Kernex Microsystems (India) Limited - Clarification

25-Oct-2019 | Source : NSE

Kernex Microsystems (India) Limited with respect to announcement dated 12-Oct-2019, regarding resignation of Mr Dinakara Rao Pasupuleti as Non- Executive Independent Director of the company w.e.f. October 12, 2019. On basis of above the Company is required to clarify following: 1. Confirmation from the resigning director that there is no other material reasons other than provided.The response of the Company is awaited.

Corporate Actions stock-summary

stock-summary
BOARD MEETING

No Upcoming Board Meetings

stock-summary
DIVIDEND

Kernex Microsystems (India) Ltd has declared 10% dividend, ex-date: 20 Sep 12

stock-summary
SPLITS

No Splits history available

stock-summary
BONUS

Kernex Microsystems (India) Ltd has announced 1:10 bonus issue, ex-date: 16 Oct 07

stock-summary
RIGHTS

No Rights history available

stock-summaryKey Factors

Quality key factors stock-summary

Factor
Value
Sales Growth (5y)
114.31%
EBIT Growth (5y)
211.26%
EBIT to Interest (avg)
-2.90
Debt to EBITDA (avg)
Negative Net Debt
Net Debt to Equity (avg)
0.54
Sales to Capital Employed (avg)
0.41
Tax Ratio
25.41%
Dividend Payout Ratio
0
Pledged Shares
8.87%
Institutional Holding
2.59%
ROCE (avg)
-5.14%
ROE (avg)
13.48%

Valuation key factors

Factor
Value
P/E Ratio
17
Industry P/E
21
Price to Book Value
12.93
EV to EBIT
11.44
EV to EBITDA
11.18
EV to Capital Employed
8.72
EV to Sales
3.81
PEG Ratio
0.07
Dividend Yield
NA
ROCE (Latest)
37.30%
ROE (Latest)
35.60%

Technicals key factors

Indicator
Weekly
Monthly
MACD
Mildly Bearish
Bullish
RSI
No Signal
No Signal
Bollinger Bands
Mildly Bullish
Mildly Bullish
Moving Averages
Mildly Bullish (Daily)
KST
Mildly Bearish
Bullish
Dow Theory
No Trend
Bullish
OBV
Mildly Bearish
Bullish
stock-summary Technical Indicator Scale: Bearish, Mildly Bearish, Sideways, Mildly Bullish, Bullish  Turned 
stock-summaryShareholding
Shareholding Snapshot : Jun 2026stock-summary
Shareholding Compare (%holding) stock-summary
Majority shareholders

Non Institution

Pledged Promoter Holdings

8.8718

Mutual Funds

Held by 0 Schemes

FIIs

Held by 10 FIIs (2.48%)

Promoter with highest holding

Anji Raju Manthena (14.8%)

Highest Public shareholder

Mrt Signals Limited (2.58%)

Individual Investors Holdings

51.2%

stock-summaryFinancial
[
  {
    "link": "quarterly",
    "btn_text": "All Quarterly Results",
    "header": "Quarterly Results Snapshot (Consolidated) - Jun'26 - QoQ",
    "rhs": [
      {
        "prefix": "Net Sales ",
        "suffix": "QoQ Growth in quarter ended Jun 2026 is 97.81% vs 250.66% in Mar 2026",
        "dir": -1
      },
      {
        "prefix": "Consolidated Net Profit ",
        "suffix": "QoQ Growth in quarter ended Jun 2026 is 60.93% vs 1,030.13% in Mar 2026",
        "dir": -1
      }
    ],
    "table": {
      "header": [
        "Jun'26",
        "Mar'26",
        "Change(%)"
      ],
      "body": [
        {
          "field": "Net Sales",
          "val1": "503.58",
          "val2": "254.58",
          "chgp": "97.81%",
          "chgp_class": "positive"
        },
        {
          "field": "Operating Profit (PBDIT) excl Other Income",
          "val1": "162.82",
          "val2": "105.12",
          "chgp": "54.89%",
          "chgp_class": "positive"
        },
        {
          "field": "Interest",
          "val1": "13.23",
          "val2": "11.79",
          "chgp": "12.21%",
          "chgp_class": "negative"
        },
        {
          "field": "Exceptional Items",
          "val1": "0.00",
          "val2": "0.00",
          "chgp": "",
          "chgp_class": "neutral"
        },
        {
          "field": "Consolidate Net Profit",
          "val1": "109.85",
          "val2": "68.26",
          "chgp": "60.93%",
          "chgp_class": "positive"
        },
        {
          "field": "Operating Profit Margin (Excl OI)",
          "val1": "32.33%",
          "val2": "41.29%",
          "chgp": "-8.96%",
          "chgp_class": "negative"
        }
      ]
    }
  },
  {
    "link": "half-yearly",
    "btn_text": "All Half Yearly Results",
    "header": "Half Yearly Results Snapshot (Consolidated) - Sep'25",
    "rhs": [
      {
        "prefix": "Net Sales ",
        "suffix": " Growth in half year ended Sep 2025 is 47.42% vs 2,849.37% in Sep 2024",
        "dir": -1
      },
      {
        "prefix": "Consolidated Net Profit ",
        "suffix": " Growth in half year ended Sep 2025 is 34.10% vs 297.92% in Sep 2024",
        "dir": -1
      }
    ],
    "table": {
      "header": [
        "Sep'25",
        "Sep'24",
        "Change(%)"
      ],
      "body": [
        {
          "field": "Net Sales",
          "val1": "103.05",
          "val2": "69.90",
          "chgp": "47.42%",
          "chgp_class": "positive"
        },
        {
          "field": "Operating Profit (PBDIT) excl Other Income",
          "val1": "26.86",
          "val2": "15.11",
          "chgp": "77.76%",
          "chgp_class": "positive"
        },
        {
          "field": "Interest",
          "val1": "7.24",
          "val2": "4.09",
          "chgp": "77.02%",
          "chgp_class": "negative"
        },
        {
          "field": "Exceptional Items",
          "val1": "0.00",
          "val2": "0.00",
          "chgp": "",
          "chgp_class": "neutral"
        },
        {
          "field": "Consolidate Net Profit",
          "val1": "14.04",
          "val2": "10.47",
          "chgp": "34.10%",
          "chgp_class": "positive"
        },
        {
          "field": "Operating Profit Margin (Excl OI)",
          "val1": "26.07%",
          "val2": "21.62%",
          "chgp": "4.45%",
          "chgp_class": "positive"
        }
      ]
    }
  },
  {
    "link": "nine-monthly",
    "btn_text": "All Nine Monthly Results",
    "header": "Nine Monthly Results Snapshot (Consolidated) - Dec'25",
    "rhs": [
      {
        "prefix": "Net Sales ",
        "suffix": "YoY Growth in nine months ended Dec 2025 is 64.61% vs 899.16% in Dec 2024",
        "dir": -1
      },
      {
        "prefix": "Consolidated Net Profit ",
        "suffix": "YoY Growth in nine months ended Dec 2025 is 13.77% vs 227.99% in Dec 2024",
        "dir": -1
      }
    ],
    "table": {
      "header": [
        "Dec'25",
        "Dec'24",
        "Change(%)"
      ],
      "body": [
        {
          "field": "Net Sales",
          "val1": "175.65",
          "val2": "106.71",
          "chgp": "64.61%",
          "chgp_class": "positive"
        },
        {
          "field": "Operating Profit (PBDIT) excl Other Income",
          "val1": "43.66",
          "val2": "23.69",
          "chgp": "84.30%",
          "chgp_class": "positive"
        },
        {
          "field": "Interest",
          "val1": "16.36",
          "val2": "5.31",
          "chgp": "208.10%",
          "chgp_class": "negative"
        },
        {
          "field": "Exceptional Items",
          "val1": "0.00",
          "val2": "0.00",
          "chgp": "",
          "chgp_class": "neutral"
        },
        {
          "field": "Consolidate Net Profit",
          "val1": "20.08",
          "val2": "17.65",
          "chgp": "13.77%",
          "chgp_class": "positive"
        },
        {
          "field": "Operating Profit Margin (Excl OI)",
          "val1": "24.86%",
          "val2": "22.20%",
          "chgp": "2.66%",
          "chgp_class": "positive"
        }
      ]
    }
  },
  {
    "link": "annual",
    "btn_text": "All Annual Results",
    "header": "Annual Results Snapshot (Consolidated) - Mar'26",
    "rhs": [
      {
        "prefix": "Net Sales ",
        "suffix": "YoY Growth in year ended Mar 2026 is 126.71% vs 868.21% in Mar 2025",
        "dir": -1
      },
      {
        "prefix": "Consolidated Net Profit ",
        "suffix": "YoY Growth in year ended Mar 2026 is 75.84% vs 290.23% in Mar 2025",
        "dir": -1
      }
    ],
    "table": {
      "header": [
        "Mar'26",
        "Mar'25",
        "Change(%)"
      ],
      "body": [
        {
          "field": "Net Sales",
          "val1": "430.22",
          "val2": "189.77",
          "chgp": "126.71%",
          "chgp_class": "positive"
        },
        {
          "field": "Operating Profit (PBDIT) excl Other Income",
          "val1": "148.77",
          "val2": "40.80",
          "chgp": "264.63%",
          "chgp_class": "positive"
        },
        {
          "field": "Interest",
          "val1": "28.15",
          "val2": "6.92",
          "chgp": "306.79%",
          "chgp_class": "negative"
        },
        {
          "field": "Exceptional Items",
          "val1": "0.00",
          "val2": "0.00",
          "chgp": "",
          "chgp_class": "neutral"
        },
        {
          "field": "Consolidate Net Profit",
          "val1": "88.34",
          "val2": "50.24",
          "chgp": "75.84%",
          "chgp_class": "positive"
        },
        {
          "field": "Operating Profit Margin (Excl OI)",
          "val1": "34.58%",
          "val2": "21.50%",
          "chgp": "13.08%",
          "chgp_class": "positive"
        }
      ]
    }
  }
]

Quarterly Results Snapshot (Consolidated) - Jun'26 - QoQstock-summary

Jun'26
Mar'26
Change(%)
Net Sales
503.58
254.58
97.81%
Operating Profit (PBDIT) excl Other Income
162.82
105.12
54.89%
Interest
13.23
11.79
12.21%
Exceptional Items
0.00
0.00
Consolidate Net Profit
109.85
68.26
60.93%
Operating Profit Margin (Excl OI)
32.33%
41.29%
-8.96%
Values in Rs Cr.
Direction Arrows
Net Sales

QoQ Growth in quarter ended Jun 2026 is 97.81% vs 250.66% in Mar 2026

Direction Arrows
Consolidated Net Profit

QoQ Growth in quarter ended Jun 2026 is 60.93% vs 1,030.13% in Mar 2026

Half Yearly Results Snapshot (Consolidated) - Sep'25stock-summary

Sep'25
Sep'24
Change(%)
Net Sales
103.05
69.90
47.42%
Operating Profit (PBDIT) excl Other Income
26.86
15.11
77.76%
Interest
7.24
4.09
77.02%
Exceptional Items
0.00
0.00
Consolidate Net Profit
14.04
10.47
34.10%
Operating Profit Margin (Excl OI)
26.07%
21.62%
4.45%
Values in Rs Cr.
Direction Arrows
Net Sales

Growth in half year ended Sep 2025 is 47.42% vs 2,849.37% in Sep 2024

Direction Arrows
Consolidated Net Profit

Growth in half year ended Sep 2025 is 34.10% vs 297.92% in Sep 2024

Nine Monthly Results Snapshot (Consolidated) - Dec'25stock-summary

Dec'25
Dec'24
Change(%)
Net Sales
175.65
106.71
64.61%
Operating Profit (PBDIT) excl Other Income
43.66
23.69
84.30%
Interest
16.36
5.31
208.10%
Exceptional Items
0.00
0.00
Consolidate Net Profit
20.08
17.65
13.77%
Operating Profit Margin (Excl OI)
24.86%
22.20%
2.66%
Values in Rs Cr.
Direction Arrows
Net Sales

YoY Growth in nine months ended Dec 2025 is 64.61% vs 899.16% in Dec 2024

Direction Arrows
Consolidated Net Profit

YoY Growth in nine months ended Dec 2025 is 13.77% vs 227.99% in Dec 2024

Annual Results Snapshot (Consolidated) - Mar'26stock-summary

Mar'26
Mar'25
Change(%)
Net Sales
430.22
189.77
126.71%
Operating Profit (PBDIT) excl Other Income
148.77
40.80
264.63%
Interest
28.15
6.92
306.79%
Exceptional Items
0.00
0.00
Consolidate Net Profit
88.34
50.24
75.84%
Operating Profit Margin (Excl OI)
34.58%
21.50%
13.08%
Values in Rs Cr.
Direction Arrows
Net Sales

YoY Growth in year ended Mar 2026 is 126.71% vs 868.21% in Mar 2025

Direction Arrows
Consolidated Net Profit

YoY Growth in year ended Mar 2026 is 75.84% vs 290.23% in Mar 2025

stock-summaryCompany CV
About Kernex Microsystems (India) Ltd stock-summary
stock-summary
Kernex Microsystems (India) Ltd
Small Cap
Transport Services
Kernex Microsystems (India) Ltd was incorporated on September 16, 1991 with the object of designing, developing, installing and maintaining software packages for domestic and international markets. The company was registered as 100% Export Oriented Unit with Software Technology Parks of India, Department of Electronics, Govt. of India, New Delhi. The Company is a software development and consultancy company.
Company Coordinates stock-summary
Company Details
No 38 to 41 Sy No 1/1 M Mandal, Hardware Park Raviryal Village Hyderabad Telangana : 501510
stock-summary
Tel: 91-9948488877
stock-summary
md@kernex.in/acs@kernex.in
Registrar Details
Karvy Computershare Pvt Ltd, Plot No 17-24 , Near Image Hospital,, Reliance Cybervilae,Vithalrao Nagar,, Madhapur, Hyderabad