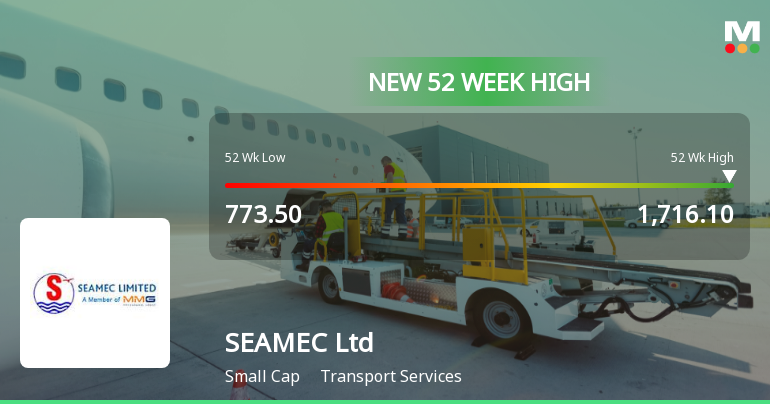
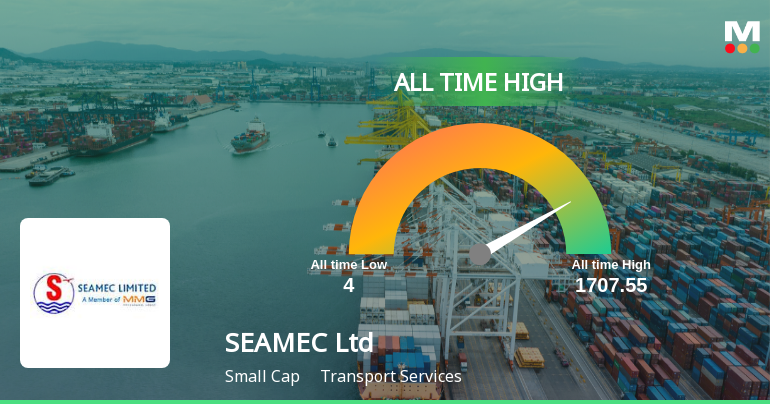
SEAMEC Ltd

  • Market Cap: Small Cap
  • Industry: Transport Services
  • ISIN: INE497B01018
  • NSEID: SEAMECLTD
  • BSEID: 526807
INR
1,424.90
-18.7 (-1.3%)
BSENSE

Jul 10, 03:30 PM

BSE+NSE Vol: 18.91 k

  • Price Points
  • Score
  • Mojo Parameters
  • Total Return
  • News and Corporate Actions
  • Key factors
  • Shareholding
  • Financials
  • CompanyCV
stock-summaryPrice Point
High/Low

1Day

52 Week

Valuation
Technical
Day's Volume

CASH

18.91 k (-55.80%) Volume

Shareholding (Mar 2026)

FII

3.73%

Held by 46 FIIs

DII

4.51%

Held by 4 DIIs

Promoter

72.72%

Why is SEAMEC Ltd falling/rising?

10-Jul-2026

As of 09-Jul, SEAMEC Ltd's stock price is rising, currently at 1,449.15 with a 1.75 (0.12%) increase. The company has shown strong long-term growth, with a year-to-date increase of 31.32% and a net profit growth of 152.8%, supported by increasing institutional investment.

As of 09-Jul, SEAMEC Ltd's stock price is rising, evidenced by a current price of 1,449.15, which reflects a change of 1.75 (0.12%) upward. The stock has shown a positive trend over the last two days, gaining 1.36% during this period. Despite a recent underperformance against its sector by -1.45%, the stock has demonstrated strong long-term growth, with a year-to-date increase of 31.32% and a remarkable 71.50% rise over the past year, significantly outperforming the broader market, which has seen negative returns.<BR><BR>Additionally, the company has reported very positive financial results, including a net profit growth of 152.8% and a strong operating profit growth rate of 46.20%. The low Debt to EBITDA ratio of 0.88 times indicates a strong ability to service debt, further supporting investor confidence. Furthermore, institutional investors have increased their stake in the company, suggesting a growing confidence in its fundamentals. This combination of positive financial performance and increasing institutional interest contributes to the upward movement in SEAMEC Ltd's stock price.

View full answer

How big is SEAMEC Ltd?

11-Jun-2026

As of 10th June, SEAMEC Ltd has a market capitalization of 4,118.00 Cr, with recent Net Sales of 952.46 Cr and a Net Profit of 251.39 Cr. Shareholder's Funds are 1,007.87 Cr and Total Assets are 1,377.17 Cr as of March 2025.

As of 10th June, SEAMEC Ltd has a market capitalization of 4,118.00 Cr, categorizing it as a Small Cap company.<BR><BR>In the latest four quarters, SEAMEC Ltd reported Net Sales of 952.46 Cr and a Net Profit of 251.39 Cr.<BR><BR>The latest annual period for the balance sheet is March 2025, where Shareholder's Funds amounted to 1,007.87 Cr and Total Assets were valued at 1,377.17 Cr.

View full answer

Who are in the management team of SEAMEC Ltd?

11-Jun-2026

The management team of SEAMEC Ltd includes Sanjeev Agrawal (Chairman), S S Kohli, Deepak Shetty, and Ruby Srivastava (Independent Directors), S N Mohanty (President & Company Secretary), Naveen Mohta (Whole-time Director), and Subrat Das (Director).

The management team of SEAMEC Ltd includes the following individuals:<BR><BR>1. **Sanjeev Agrawal** - Chairman (Non-Executive)<BR>2. **S S Kohli** - Independent Director<BR>3. **S N Mohanty** - President & Company Secretary<BR>4. **Naveen Mohta** - Whole-time Director<BR>5. **Subrat Das** - Director<BR>6. **Deepak Shetty** - Independent Director<BR>7. **Ruby Srivastava** - Independent Director<BR><BR>If you need more details about any specific member or their roles, feel free to ask!

View full answer

Who are the peers of the SEAMEC Ltd?

11-Jun-2026

SEAMEC Ltd's peers include Blue Dart Express, Blackbuck, Transport Corp., TVS Supply, VRL Logistics, Mahindra Logistics, Kernex Microsys, Gateway Distri, Afcom Holdings, and TCI Express. SEAMEC Ltd has below-average management risk and capital structure, with a strong 1-year return of 85.20%, compared to peers like Blackbuck at 15.08% and Blue Dart Express at -28.03%.

Peers: The peers of SEAMEC Ltd are Blue Dart Expres, Blackbuck, Transport Corp., TVS Supply, VRL Logistics, Mahindra Logis., Kernex Microsys., Gateway Distri, Afcom Holdings, and TCI Express.<BR><BR>Quality Snapshot: Excellent management risk is observed at Blue Dart Expres, Transport Corp., VRL Logistics, Gateway Distri, Afcom Holdings, and TCI Express, while Average management risk is found at Blackbuck, Mahindra Logis., and Kernex Microsys., and the rest. Below Average management risk is noted for SEAMEC Ltd and TVS Supply. Growth is Excellent for Blackbuck, SEAMEC Ltd, Kernex Microsys., and Afcom Holdings, while Average growth is seen at Blue Dart Expres, VRL Logistics, and Mahindra Logis., and the rest. Below Average growth is indicated for Transport Corp. and TVS Supply. Capital Structure is rated as Good for Blue Dart Expres, SEAMEC Ltd, Gateway Distri, and Afcom Holdings, while Average capital structure is found at VRL Logistics and Kernex Microsys., and the rest. Below Average capital structure is noted for TVS Supply and Mahindra Logis.<BR><BR>Return Snapshot: The peer with the highest 1-year return is Blackbuck at 15.08%, while the lowest is Blue Dart Expres at -28.03%. SEAMEC Ltd's 1-year return is significantly higher at 85.20%. Additionally, peers with negative six-month returns include VRL Logistics, Mahindra Logis., and Gateway Distri.

View full answer

What does SEAMEC Ltd do?

10-Jun-2026

SEAMEC Ltd is a small-cap company in the transport services industry, primarily focused on marine engineering and construction. As of March 2026, it reported net sales of ₹327 Cr and a net profit of ₹103 Cr.

Overview:<BR>SEAMEC Ltd is a company operating in the transport services industry, categorized as a small-cap entity.<BR><BR>History:<BR>SEAMEC Ltd was incorporated in 1986 as 'Peerless Shipping & Oilfield Services Limited'. The company underwent several name changes, becoming 'South East Asia Marine Engineering & Construction Limited' in 2000 and finally 'SEAMEC Limited' in 2007. The most recent quarterly results reported net sales and net profit for the period ending March 2026.<BR><BR>Financial Snapshot:<BR>- Net Sales: 327 Cr (Quarterly Results - Mar 2026)<BR>- Net Profit: 103 Cr (Quarterly Results - Mar 2026)<BR>- Market Cap: INR 4,118 Cr (Small Cap)<BR><BR>Key Metrics:<BR>- P/E: 16.00<BR>- Industry P/E: 10<BR>- Dividend Yield: 0.00%<BR>- Debt Equity: 0.13<BR>- Return on Equity: 19.32%<BR>- Price to Book: 3.15<BR><BR>Contact Details:<BR>- Address: A 901-905 9th Floor 215 Atrium, Andheri Kurla Road Andheri(E) Mumbai Maharashtra : 400093<BR>- Tel: 91-22-66941800<BR>- Email: contact@seamec.in/seamec@bom5.vsnl.<BR>- Website: http://www.seamec.in; www.technip.com

View full answer

Should I buy, sell or hold SEAMEC Ltd?

09-Jun-2026

Are SEAMEC Ltd latest results good or bad?

19-May-2026

SEAMEC Ltd's latest Q4 FY26 results are strong, with net sales of ₹327.07 crores (up 63.85% year-on-year) and a net profit of ₹103.48 crores (up 140.76%). The company shows robust revenue growth and improved profitability, indicating a positive financial trajectory.

SEAMEC Ltd's latest results for Q4 FY26 are quite impressive. The company reported net sales of ₹327.07 crores, which reflects a substantial year-on-year growth of 63.85%. This marks the highest quarterly revenue in the company's history. Additionally, net profit surged to ₹103.48 crores, representing a remarkable increase of 140.76% compared to the same quarter last year.<BR><BR>The operating margin also saw significant improvement, reaching 48.66%, the strongest level in years. This demonstrates SEAMEC's ability to effectively convert revenue growth into profitability. The company's performance indicates a strong recovery from previous volatility, particularly following a loss in Q3 FY26.<BR><BR>Overall, the results suggest a positive trajectory for SEAMEC, showcasing robust revenue growth, exceptional margin expansion, and a solid recovery from earlier setbacks. This performance has also translated into impressive stock returns, with a 92.83% increase over the past year. Thus, the latest results can be characterized as good, reflecting strong operational execution and financial health.

View full answer

When is the next results date for SEAMEC Ltd?

14-May-2026

The next results date for SEAMEC Ltd is 18 May 2026.

The next results date for SEAMEC Ltd is scheduled for 18 May 2026.

View full answer

Is SEAMEC Ltd technically bullish or bearish?

27-Nov-2025

As of November 26, 2025, SEAMEC Ltd's trend has shifted to mildly bearish with a current price of 913.50, despite recent gains, as it has underperformed year-to-date with a -23.36% return compared to the Sensex's 9.56%.

As of 26 November 2025, the technical trend for SEAMEC Ltd has changed from bearish to mildly bearish. The current price is 913.50, showing a recent increase from the previous close of 874.75. However, the stock has underperformed significantly year-to-date with a return of -23.36%, compared to the Sensex's 9.56%. The 52-week range indicates volatility, with a high of 1,299.90 and a low of 753.00. Despite the recent short-term gains, the overall trend remains mildly bearish, reflecting weakness in the longer-term performance.

View full answer

How has been the historical performance of SEAMEC Ltd?

12-Nov-2025

SEAMEC Ltd experienced fluctuations in financial performance, with net sales and profits declining from March 2024 to March 2025, while reserves increased and cash flow from operations improved significantly. Total liabilities and assets saw minor declines during the same period.

Answer:<BR>The historical performance of SEAMEC Ltd shows fluctuations in key financial metrics over the years, with notable changes in revenue and profit.<BR><BR>Breakdown:<BR>SEAMEC Ltd's net sales peaked at 729.29 Cr in March 2024 but fell to 651.82 Cr in March 2025. The total operating income followed a similar trend, decreasing from 729.29 Cr in March 2024 to 651.82 Cr in March 2025. Operating profit (PBDIT) also declined from 271.07 Cr in March 2024 to 244.11 Cr in March 2025, while profit before tax decreased from 120.03 Cr to 106.84 Cr in the same period. The profit after tax saw a drop from 120.65 Cr in March 2024 to 87.91 Cr in March 2025. Despite these declines, the company maintained a strong reserve position, increasing from 886.00 Cr in March 2024 to 982.45 Cr in March 2025. The total liabilities slightly decreased from 1,404.85 Cr to 1,377.17 Cr, while total assets also saw a minor decline from 1,404.85 Cr to 1,377.17 Cr. Cash flow from operating activities improved significantly from 149.00 Cr in March 2024 to 298.00 Cr in March 2025, contributing to a net cash inflow of 22.00 Cr in March 2025, compared to a net outflow of 24.00 Cr in March 2024. Overall, SEAMEC Ltd experienced a mixed performance with declines in sales and profits, but an increase in reserves and improved cash flow from operations.

View full answer

Is SEAMEC Ltd overvalued or undervalued?

09-Jun-2025

As of January 2, 2025, SEAMEC Ltd is considered overvalued with a valuation grade of "expensive," reflected by a PE Ratio of 27.51, significantly higher than its peers, and a year-to-date return of -25.93%, compared to the Sensex's 5.63% gain.

As of 2 January 2025, the valuation grade for SEAMEC Ltd has moved from very expensive to expensive, indicating a shift in perception regarding its market value. The company is currently considered overvalued. Key ratios include a PE Ratio of 27.51, an EV to EBITDA of 10.90, and a Price to Book Value of 2.22, which suggest that the stock is trading at a premium compared to its earnings and book value.<BR><BR>In comparison to its peers, SEAMEC Ltd's PE Ratio significantly exceeds that of GE Shipping Co, which stands at 6.01, and S C I, which has a PE Ratio of 11.79, highlighting the relative overvaluation of SEAMEC Ltd. Additionally, the company's recent stock performance has been underwhelming, with a year-to-date return of -25.93%, contrasting with the Sensex's positive return of 5.63% over the same period.

View full answer

Who are the top shareholders of the SEAMEC Ltd?

06-Jun-2025

The top shareholders of SEAMEC Ltd include Hal Offshore Limited with 70.36%, mutual funds at 6.24%, foreign institutional investors at 3.05%, and individual investors holding 9.79%, with Nippon Life India Trustee Ltd being the largest public shareholder at 3.58%.

The top shareholders of SEAMEC Ltd are primarily its promoters, with Hal Offshore Limited holding the largest stake at 70.36%. In addition to the promoters, mutual funds hold 6.24% through three schemes, while foreign institutional investors (FIIs) account for 3.05% with 34 different FIIs involved. The highest public shareholder is Nippon Life India Trustee Ltd, which manages the Nippon India Small Cap Fund, holding 3.58%. Individual investors collectively own 9.79% of the company.

View full answer

Has SEAMEC Ltd declared dividend?

06-Jun-2025

SEAMEC Ltd has declared a 10% dividend, amounting to 1 per share, with an ex-date of 18 Feb 21. Despite this, the dividend yield is 0%, and total returns have varied significantly across different periods, with a notable positive return of 141.37% over five years.

SEAMEC Ltd has declared a 10% dividend.<BR><BR>Dividend Details:<BR>- Percentage announced: 10%<BR>- Amount per share: 1 per share<BR>- Ex-date: 18 Feb 21<BR><BR>Dividend Yield: 0%<BR><BR>Total Returns by Period:<BR>In the 6-month period, the price return was -26.73%, the dividend return was 0%, resulting in a total return of -26.73%.<BR><BR>In the 1-year period, the price return was -17.61%, the dividend return was 0%, leading to a total return of -17.61%.<BR><BR>Over the 2-year period, the price return was 31.99%, the dividend return was 0%, which resulted in a total return of 31.99%.<BR><BR>In the 3-year period, the price return was -14.71%, the dividend return was 0%, culminating in a total return of -14.71%.<BR><BR>For the 4-year period, the price return was 86.09%, the dividend return was 0%, giving a total return of 86.09%.<BR><BR>In the 5-year period, the price return was 140.82%, the dividend return was 0.55%, leading to a total return of 141.37%.<BR><BR>Overall, SEAMEC Ltd has declared a dividend, but the dividend yield remains at 0%. The total returns show significant variability, with a notable positive return over the longer 5-year period, despite negative returns in the shorter time frames.

View full answer
iScoreScore
Click here to find our call on this stock
Strong Sell
Sell
Hold
Buy
Strong Buy

Dashboard

1

Strong ability to service debt as the company has a low Debt to EBITDA ratio of 0.88 times

 
2

Healthy long term growth as Operating profit has grown by an annual rate 46.20%

 
3

With a growth in Net Profit of 152.8%, the company declared Very Positive results in Mar 26

4

With ROCE of 16.5, it has a Expensive valuation with a 2.6 Enterprise value to Capital Employed

5

Increasing Participation by Institutional Investors

stock-summaryMojo Parameters

Mojo Parameters

Loading Valuation Snapshot...

Stock DNA

stock-summary
Industry

Transport Services

stock-summary
Market cap

INR 3,698 Cr (Small Cap)

stock-summary
P/E

15.00

stock-summary
Industry P/E

9

stock-summary
Dividend Yield

0.00%

stock-summary
Debt Equity

0.13

stock-summary
Return on Equity

19.32%

stock-summary
Price to Book

2.83

Revenue and Profits:
Net Sales:
327 Cr
(Quarterly Results - Mar 2026)
Net Profit:
103 Cr
stock-summaryTotal Returns
Total Returns (Price + Dividend) stock-summary
Dividend Yield (0%)
TimePeriod
Price Return
Dividend Return
Total Return
3 Months
-6.58%
0%
-6.58%
6 Months
33.12%
0%
33.12%
1 Year
68.39%
0%
68.39%
2 Years
-1.09%
0%
-1.09%
3 Years
88.67%
0%
88.67%
4 Years
65.27%
0%
65.27%
5 Years
195.5%
0%
195.5%

Latest dividend: 1.001523726599913 per share ex-dividend date: Feb-18-2021

Risk Adjusted Returns v/s stock-summary
Returns Beta
Icon
Beta has not been calculated since enough price history is not available
stock-summaryNews & Corporate Actions

News

SEAMEC Ltd Falls 13.81%: Key Valuation and Price Pressure Factors This Week

Announcements stock-summary

Seamec Limited - Updates

05-Dec-2019 | Source : NSE

Seamec Limited has informed the Exchange regarding 'Intimation on Deployment Status of Vessel "SEAMEC III"'.

Seamec Limited - Updates

27-Nov-2019 | Source : NSE

Seamec Limited has informed the Exchange regarding 'Intimation on Deployment Status of Vessel "SEAMEC PRINCESS"'.

Seamec Limited - Updates

14-Nov-2019 | Source : NSE

Seamec Limited has informed the Exchange regarding 'Newspaper Advertisement Regulation 30 and Regulation 47 of the SEBI (Listing Obligations & Disclosure Requirements) Regulations, 2015 for Un-audited Financial Results of the Company for the Quarter ended 30th September, 2019 (both Standalone and Consolidated)'.

Corporate Actions stock-summary

stock-summary
BOARD MEETING

No Upcoming Board Meetings

stock-summary
DIVIDEND

SEAMEC Ltd has declared 10% dividend, ex-date: 18 Feb 21

stock-summary
SPLITS

No Splits history available

stock-summary
BONUS

No Bonus history available

stock-summary
RIGHTS

No Rights history available

stock-summaryKey Factors

Quality key factors stock-summary

Factor
Value
Sales Growth (5y)
29.97%
EBIT Growth (5y)
46.20%
EBIT to Interest (avg)
6.56
Debt to EBITDA (avg)
1.53
Net Debt to Equity (avg)
0.13
Sales to Capital Employed (avg)
0.49
Tax Ratio
5.85%
Dividend Payout Ratio
0
Pledged Shares
0
Institutional Holding
8.24%
ROCE (avg)
6.07%
ROE (avg)
11.16%

Valuation key factors

Factor
Value
P/E Ratio
15
Industry P/E
9
Price to Book Value
2.83
EV to EBIT
15.87
EV to EBITDA
9.63
EV to Capital Employed
2.63
EV to Sales
4.04
PEG Ratio
0.07
Dividend Yield
NA
ROCE (Latest)
16.54%
ROE (Latest)
19.32%

Technicals key factors

Indicator
Weekly
Monthly
MACD
Mildly Bearish
Bullish
RSI
No Signal
No Signal
Bollinger Bands
Mildly Bearish
Bullish
Moving Averages
Mildly Bullish (Daily)
KST
Mildly Bearish
Bullish
Dow Theory
No Trend
No Trend
OBV
No Trend
No Trend
stock-summary Technical Indicator Scale: Bearish, Mildly Bearish, Sideways, Mildly Bullish, Bullish  Turned 
stock-summaryShareholding
Shareholding Snapshot : Mar 2026stock-summary
Shareholding Compare (%holding) stock-summary
Majority shareholders

Promoters

Pledged Promoter Holdings

None

Mutual Funds

Held by 2 Schemes (3.59%)

FIIs

Held by 46 FIIs (3.73%)

Promoter with highest holding

Hal Offshore Limited (70.77%)

Highest Public shareholder

Nippon Life India Trustee Ltd-a/c Nippon India Small Cap Fund (3.58%)

Individual Investors Holdings

10.62%

stock-summaryFinancial
[
  {
    "link": "quarterly",
    "btn_text": "All Quarterly Results",
    "header": "Quarterly Results Snapshot (Consolidated) - Mar'26 - YoY",
    "rhs": [
      {
        "prefix": "Net Sales ",
        "suffix": "YoY Growth in quarter ended Mar 2026 is 63.85% vs -15.55% in Mar 2025",
        "dir": 1
      },
      {
        "prefix": "Consolidated Net Profit ",
        "suffix": "YoY Growth in quarter ended Mar 2026 is 140.76% vs -18.40% in Mar 2025",
        "dir": 1
      }
    ],
    "table": {
      "header": [
        "Mar'26",
        "Mar'25",
        "Change(%)"
      ],
      "body": [
        {
          "field": "Net Sales",
          "val1": "327.07",
          "val2": "199.62",
          "chgp": "63.85%",
          "chgp_class": "positive"
        },
        {
          "field": "Operating Profit (PBDIT) excl Other Income",
          "val1": "159.14",
          "val2": "81.15",
          "chgp": "96.11%",
          "chgp_class": "positive"
        },
        {
          "field": "Interest",
          "val1": "5.83",
          "val2": "4.12",
          "chgp": "41.50%",
          "chgp_class": "negative"
        },
        {
          "field": "Exceptional Items",
          "val1": "0.00",
          "val2": "0.07",
          "chgp": "-100.00%",
          "chgp_class": "negative"
        },
        {
          "field": "Consolidate Net Profit",
          "val1": "103.48",
          "val2": "42.98",
          "chgp": "140.76%",
          "chgp_class": "positive"
        },
        {
          "field": "Operating Profit Margin (Excl OI)",
          "val1": "48.66%",
          "val2": "40.65%",
          "chgp": "8.01%",
          "chgp_class": "positive"
        }
      ]
    }
  },
  {
    "link": "half-yearly",
    "btn_text": "All Half Yearly Results",
    "header": "Half Yearly Results Snapshot (Consolidated) - Sep'25",
    "rhs": [
      {
        "prefix": "Net Sales ",
        "suffix": " Growth in half year ended Sep 2025 is 1.81% vs 8.32% in Sep 2024",
        "dir": -1
      },
      {
        "prefix": "Consolidated Net Profit ",
        "suffix": " Growth in half year ended Sep 2025 is -3.34% vs 359.19% in Sep 2024",
        "dir": -1
      }
    ],
    "table": {
      "header": [
        "Sep'25",
        "Sep'24",
        "Change(%)"
      ],
      "body": [
        {
          "field": "Net Sales",
          "val1": "308.34",
          "val2": "302.86",
          "chgp": "1.81%",
          "chgp_class": "positive"
        },
        {
          "field": "Operating Profit (PBDIT) excl Other Income",
          "val1": "104.72",
          "val2": "88.26",
          "chgp": "18.65%",
          "chgp_class": "positive"
        },
        {
          "field": "Interest",
          "val1": "8.48",
          "val2": "7.95",
          "chgp": "6.67%",
          "chgp_class": "negative"
        },
        {
          "field": "Exceptional Items",
          "val1": "0.00",
          "val2": "8.74",
          "chgp": "-100.00%",
          "chgp_class": "negative"
        },
        {
          "field": "Consolidate Net Profit",
          "val1": "48.29",
          "val2": "49.96",
          "chgp": "-3.34%",
          "chgp_class": "negative"
        },
        {
          "field": "Operating Profit Margin (Excl OI)",
          "val1": "33.96%",
          "val2": "29.14%",
          "chgp": "4.82%",
          "chgp_class": "positive"
        }
      ]
    }
  },
  {
    "link": "nine-monthly",
    "btn_text": "All Nine Monthly Results",
    "header": "Nine Monthly Results Snapshot (Consolidated) - Dec'25",
    "rhs": [
      {
        "prefix": "Net Sales ",
        "suffix": "YoY Growth in nine months ended Dec 2025 is 38.30% vs -8.26% in Dec 2024",
        "dir": 1
      },
      {
        "prefix": "Consolidated Net Profit ",
        "suffix": "YoY Growth in nine months ended Dec 2025 is 217.13% vs -30.43% in Dec 2024",
        "dir": 1
      }
    ],
    "table": {
      "header": [
        "Dec'25",
        "Dec'24",
        "Change(%)"
      ],
      "body": [
        {
          "field": "Net Sales",
          "val1": "625.39",
          "val2": "452.20",
          "chgp": "38.30%",
          "chgp_class": "positive"
        },
        {
          "field": "Operating Profit (PBDIT) excl Other Income",
          "val1": "240.53",
          "val2": "132.53",
          "chgp": "81.49%",
          "chgp_class": "positive"
        },
        {
          "field": "Interest",
          "val1": "14.96",
          "val2": "11.37",
          "chgp": "31.57%",
          "chgp_class": "negative"
        },
        {
          "field": "Exceptional Items",
          "val1": "0.00",
          "val2": "8.77",
          "chgp": "-100.00%",
          "chgp_class": "negative"
        },
        {
          "field": "Consolidate Net Profit",
          "val1": "147.91",
          "val2": "46.64",
          "chgp": "217.13%",
          "chgp_class": "positive"
        },
        {
          "field": "Operating Profit Margin (Excl OI)",
          "val1": "38.46%",
          "val2": "29.31%",
          "chgp": "9.15%",
          "chgp_class": "positive"
        }
      ]
    }
  },
  {
    "link": "annual",
    "btn_text": "All Annual Results",
    "header": "Annual Results Snapshot (Consolidated) - Mar'26",
    "rhs": [
      {
        "prefix": "Net Sales ",
        "suffix": "YoY Growth in year ended Mar 2026 is 46.12% vs -10.62% in Mar 2025",
        "dir": 1
      },
      {
        "prefix": "Consolidated Net Profit ",
        "suffix": "YoY Growth in year ended Mar 2026 is 180.51% vs -25.13% in Mar 2025",
        "dir": 1
      }
    ],
    "table": {
      "header": [
        "Mar'26",
        "Mar'25",
        "Change(%)"
      ],
      "body": [
        {
          "field": "Net Sales",
          "val1": "952.46",
          "val2": "651.82",
          "chgp": "46.12%",
          "chgp_class": "positive"
        },
        {
          "field": "Operating Profit (PBDIT) excl Other Income",
          "val1": "399.67",
          "val2": "213.68",
          "chgp": "87.04%",
          "chgp_class": "positive"
        },
        {
          "field": "Interest",
          "val1": "20.79",
          "val2": "15.49",
          "chgp": "34.22%",
          "chgp_class": "negative"
        },
        {
          "field": "Exceptional Items",
          "val1": "0.00",
          "val2": "8.84",
          "chgp": "-100.00%",
          "chgp_class": "negative"
        },
        {
          "field": "Consolidate Net Profit",
          "val1": "251.39",
          "val2": "89.62",
          "chgp": "180.51%",
          "chgp_class": "positive"
        },
        {
          "field": "Operating Profit Margin (Excl OI)",
          "val1": "41.96%",
          "val2": "32.78%",
          "chgp": "9.18%",
          "chgp_class": "positive"
        }
      ]
    }
  }
]

Quarterly Results Snapshot (Consolidated) - Mar'26 - YoYstock-summary

Mar'26
Mar'25
Change(%)
Net Sales
327.07
199.62
63.85%
Operating Profit (PBDIT) excl Other Income
159.14
81.15
96.11%
Interest
5.83
4.12
41.50%
Exceptional Items
0.00
0.07
-100.00%
Consolidate Net Profit
103.48
42.98
140.76%
Operating Profit Margin (Excl OI)
48.66%
40.65%
8.01%
Values in Rs Cr.
Direction Arrows
Net Sales

YoY Growth in quarter ended Mar 2026 is 63.85% vs -15.55% in Mar 2025

Direction Arrows
Consolidated Net Profit

YoY Growth in quarter ended Mar 2026 is 140.76% vs -18.40% in Mar 2025

Half Yearly Results Snapshot (Consolidated) - Sep'25stock-summary

Sep'25
Sep'24
Change(%)
Net Sales
308.34
302.86
1.81%
Operating Profit (PBDIT) excl Other Income
104.72
88.26
18.65%
Interest
8.48
7.95
6.67%
Exceptional Items
0.00
8.74
-100.00%
Consolidate Net Profit
48.29
49.96
-3.34%
Operating Profit Margin (Excl OI)
33.96%
29.14%
4.82%
Values in Rs Cr.
Direction Arrows
Net Sales

Growth in half year ended Sep 2025 is 1.81% vs 8.32% in Sep 2024

Direction Arrows
Consolidated Net Profit

Growth in half year ended Sep 2025 is -3.34% vs 359.19% in Sep 2024

Nine Monthly Results Snapshot (Consolidated) - Dec'25stock-summary

Dec'25
Dec'24
Change(%)
Net Sales
625.39
452.20
38.30%
Operating Profit (PBDIT) excl Other Income
240.53
132.53
81.49%
Interest
14.96
11.37
31.57%
Exceptional Items
0.00
8.77
-100.00%
Consolidate Net Profit
147.91
46.64
217.13%
Operating Profit Margin (Excl OI)
38.46%
29.31%
9.15%
Values in Rs Cr.
Direction Arrows
Net Sales

YoY Growth in nine months ended Dec 2025 is 38.30% vs -8.26% in Dec 2024

Direction Arrows
Consolidated Net Profit

YoY Growth in nine months ended Dec 2025 is 217.13% vs -30.43% in Dec 2024

Annual Results Snapshot (Consolidated) - Mar'26stock-summary

Mar'26
Mar'25
Change(%)
Net Sales
952.46
651.82
46.12%
Operating Profit (PBDIT) excl Other Income
399.67
213.68
87.04%
Interest
20.79
15.49
34.22%
Exceptional Items
0.00
8.84
-100.00%
Consolidate Net Profit
251.39
89.62
180.51%
Operating Profit Margin (Excl OI)
41.96%
32.78%
9.18%
Values in Rs Cr.
Direction Arrows
Net Sales

YoY Growth in year ended Mar 2026 is 46.12% vs -10.62% in Mar 2025

Direction Arrows
Consolidated Net Profit

YoY Growth in year ended Mar 2026 is 180.51% vs -25.13% in Mar 2025

stock-summaryCompany CV
About SEAMEC Ltd stock-summary
stock-summary
SEAMEC Ltd
Small Cap
Transport Services
SEAMEC Limited was erstwhile incorporated as 'Peerless Shipping & Oilfield Services Limited' in 1986. The name of the Company was thereafter changed to 'South East Asia Marine Engineering & Construction Limited' in 2000 and further was changed to 'SEAMEC Limited' in 2007.
Company Coordinates stock-summary
Company Details
A 901-905 9th Floor 215 Atrium, Andheri Kurla Road Andheri(E) Mumbai Maharashtra : 400093
stock-summary
Tel: 91-22-66941800
stock-summary
contact@seamec.in/seamec@bom5.vsnl.
Registrar Details
CB Management Services Pvt Ltd , (Formerly Choksey Bhargava & Co Ltd) , P-22, P 22 Bondel Road, Calcutta