
Compare Kesoram Inds. with Similar Stocks
Dashboard
With a Operating Losses, the company has a Weak Long Term Fundamental Strength
- Poor long term growth as Net Sales has grown by an annual rate of -37.77% and Operating profit at -178.92% over the last 5 years
- High Debt Company with a Debt to Equity ratio (avg) of 6.03 times
- The company has reported losses. Due to this company has reported negative ROE
Flat results in Mar 26
Risky - Negative EBITDA
Stock DNA
Cement & Cement Products
INR 349 Cr (Micro Cap)
NA (Loss Making)
34
0.00%
0.55
-12.54%
0.94
Total Returns (Price + Dividend) 
Latest dividend: 1 per share ex-dividend date: May-15-2013
Risk Adjusted Returns v/s
Returns Beta

News
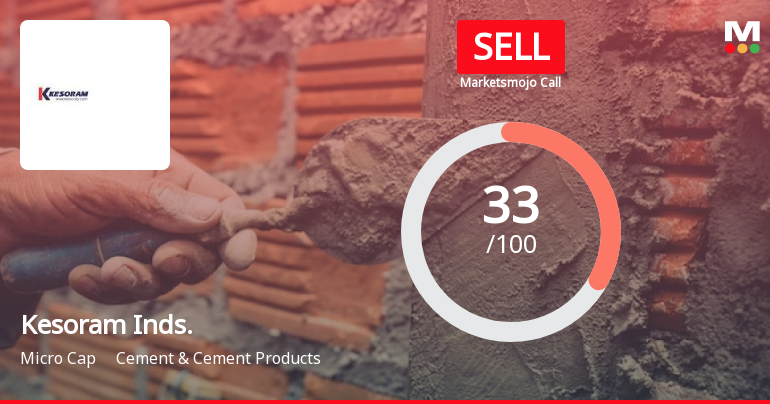
Kesoram Industries Ltd is Rated Sell
Kesoram Industries Ltd is rated 'Sell' by MarketsMOJO, with this rating last updated on 06 April 2026. However, the analysis and financial metrics discussed here reflect the stock's current position as of 11 July 2026, providing investors with an up-to-date view of the company’s fundamentals, returns, and market standing.
Read full news article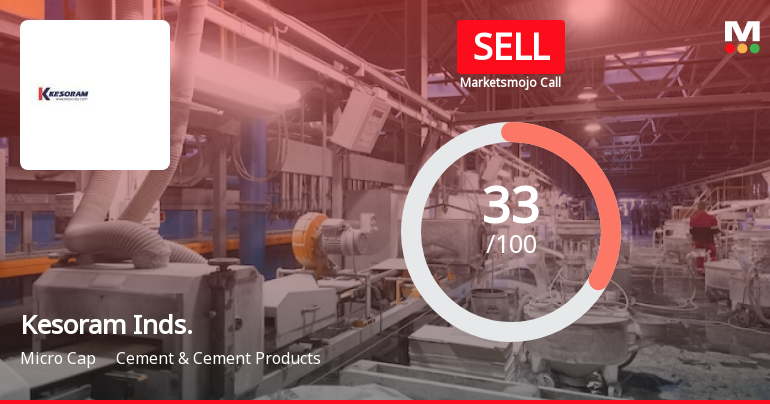
Kesoram Industries Ltd is Rated Sell by MarketsMOJO
Kesoram Industries Ltd is rated Sell by MarketsMOJO, with this rating last updated on 06 April 2026. However, the analysis and financial metrics discussed here reflect the company’s current position as of 26 June 2026, providing investors with the latest insights into its performance and outlook.
Read full news article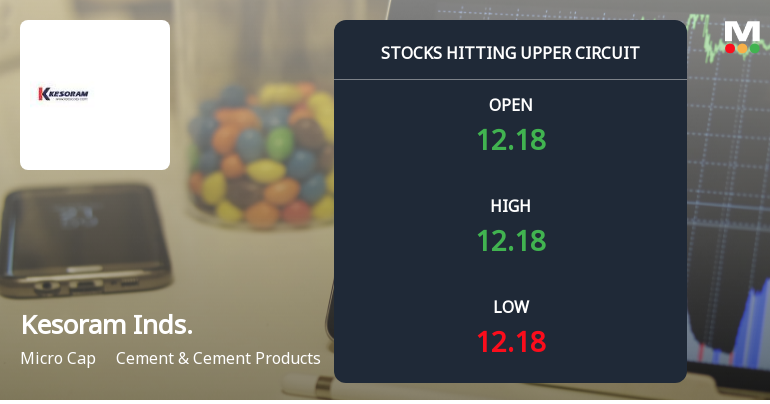
Kesoram Industries Ltd Locks at Upper Circuit With 5% Gain — Buyers Queue, Sellers Absent
At Rs 12.09, the buying was done — not because demand dried up, but because the exchange wouldn't let the stock go any higher. Kesoram Industries Ltd locked at its upper circuit of 5% on 15 Jun 2026, with buyers queuing and no sellers willing to part with shares.
Read full news article Announcements
Announcement under Regulation 30 (LODR)-Newspaper Publication
13-Jul-2026 | Source : BSENewspaper publication - Public Notice - 107th Annual General Meeting
Compliances-Certificate under Reg. 74 (5) of SEBI (DP) Regulations 2018
06-Jul-2026 | Source : BSECertificate under Regulation 74(5) of SEBI (Depositories and Participants) Regulations 2018 for the quarter ended June 2026.
Closure of Trading Window
24-Jun-2026 | Source : BSEIntimation of Closure of Trading Window - SEBI (Prohibition of Insider Trading) Regulations 2015
Corporate Actions

No Upcoming Board Meetings

Kesoram Industries Ltd has declared 10% dividend, ex-date: 15 May 13

No Splits history available

No Bonus history available

Kesoram Industries Ltd has announced 133:274 rights issue, ex-date: 16 Sep 21
Quality key factors
Valuation key factors
Technicals key factors
 Technical Indicator Scale: Bearish, Mildly Bearish, Sideways, Mildly Bullish, Bullish Turned
 Shareholding Snapshot : Jun 2026
Shareholding Compare (%holding)
Non Institution
None
Held by 5 Schemes (0.0%)
Held by 4 FIIs (0.14%)
Manav Investment And Trading Co. Ltd. (22.15%)
Icici Bank Ltd (3.9%)
40.83%
Quarterly Results Snapshot (Consolidated) - Mar'26 - QoQ

QoQ Growth in quarter ended Mar 2026 is 2.84% vs 17.42% in Dec 2025

QoQ Growth in quarter ended Mar 2026 is 416.11% vs 123.27% in Dec 2025
Half Yearly Results Snapshot (Consolidated) - Sep'25
Growth in half year ended Sep 2025 is -7.75% vs 14.48% in Sep 2024
Growth in half year ended Sep 2025 is 4.63% vs -43.44% in Sep 2024
Nine Monthly Results Snapshot (Consolidated) - Dec'25
YoY Growth in nine months ended Dec 2025 is -5.47% vs 8.51% in Dec 2024
YoY Growth in nine months ended Dec 2025 is 40.54% vs -42.46% in Dec 2024
Annual Results Snapshot (Consolidated) - Mar'26
YoY Growth in year ended Mar 2026 is -4.31% vs 5.02% in Mar 2025
YoY Growth in year ended Mar 2026 is -101.58% vs 1,559.22% in Mar 2025
About Kesoram Industries Ltd

Company Coordinates


