
Compare Kewal Kir.Cloth. with Similar Stocks
Dashboard
High Management Efficiency with a high ROE of 18.87%
The company is Net-Debt Free
Healthy long term growth as Net Sales has grown by an annual rate of 31.95% and Operating profit at 74.33%
Positive results in Mar 26
With ROE of 15.1, it has a Fair valuation with a 3.3 Price to Book Value
Majority shareholders : Promoters
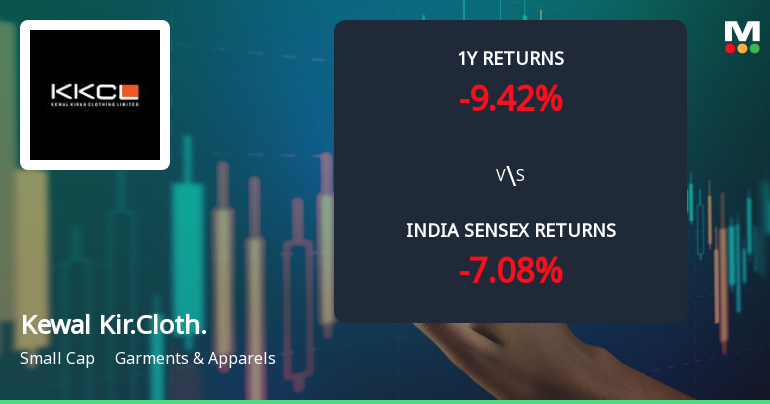
Consistent Underperformance against the benchmark over the last 3 years
Stock DNA
Garments & Apparels
INR 3,079 Cr (Small Cap)
22.00
26
0.80%
-0.20
15.06%
3.27
Total Returns (Price + Dividend) 
Latest dividend: 1.9838551325406346 per share ex-dividend date: May-14-2026
Risk Adjusted Returns v/s
Returns Beta

News
Kewal Kiran Clothing Ltd Technical Momentum Shifts Amid Mixed Market Signals
Kewal Kiran Clothing Ltd, a small-cap player in the Garments & Apparels sector, has experienced a notable shift in its technical momentum, moving from a sideways trend to a mildly bearish stance. Despite a recent downgrade in daily moving averages and weekly RSI bearishness, some monthly and weekly indicators suggest underlying bullish tendencies, creating a complex technical landscape for investors to navigate.
Read full news article
Kewal Kiran Clothing Ltd Technical Momentum Shifts Signal Sideways Trend
Kewal Kiran Clothing Ltd has exhibited a notable shift in its technical momentum, moving from a mildly bearish stance to a sideways trend, reflecting a complex interplay of bullish and bearish indicators. The stock’s recent upgrade from a Sell to a Hold rating by MarketsMOJO, alongside a 1.45% day gain, underscores evolving market sentiment amid mixed signals from key technical parameters such as MACD, RSI, and moving averages.
Read full news article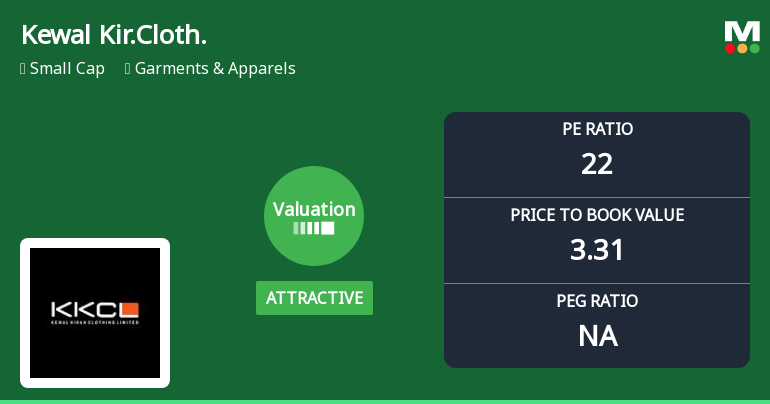
Kewal Kiran Clothing Ltd Valuation Turns Attractive Amid Sector Comparisons
Kewal Kiran Clothing Ltd has witnessed a notable improvement in its valuation parameters, shifting from a fair to an attractive rating. This change reflects a more favourable price-to-earnings (P/E) and price-to-book value (P/BV) ratio compared to its historical averages and peer group, signalling enhanced price attractiveness for investors in the garments and apparels sector.
Read full news article Announcements
Kewal Kiran Clothing Limited - Dividend Updates
23-Oct-2019 | Source : NSEKewal Kiran Clothing Limited has informed the Exchange that the Board of Directors have in their meeting held on October 22, 2019 declared a 2nd interim dividend @ 100% i.e Rs. 10/- per share on 1,23,25,037 equity shares of Rs. 10/- each for the financial year 2019-20
Shareholders meeting
19-Sep-2019 | Source : NSE
| Kewal Kiran Clothing Limited has submitted the Exchange a copy Srutinizers report of Annual General Meeting held on September 18, 2019. Further, the company has informed the Exchange regarding voting results. |
Reply to Clarification- Financial results
29-Aug-2019 | Source : NSE
| The Exchange had sought clarification from Kewal Kiran Clothing Limited for the quarter ended 30-Jun-2019 with respect to Regulation 33 of the SEBI (Listing Obligations and Disclosure Requirements) Regulations, 2015. On basis of above the Company was required to clarify the following: -1. Limited Review Report/ Independent Auditor's Report is not in the format prescribed by SEBI The response of the Company is enclosed. |
Corporate Actions

No Upcoming Board Meetings

Kewal Kiran Clothing Ltd has declared 20% dividend, ex-date: 14 May 26

No Splits history available

Kewal Kiran Clothing Ltd has announced 4:1 bonus issue, ex-date: 16 Dec 21

No Rights history available
Quality key factors
Valuation key factors
Technicals key factors
 Technical Indicator Scale: Bearish, Mildly Bearish, Sideways, Mildly Bullish, Bullish Turned
 Shareholding Snapshot : Mar 2026
Shareholding Compare (%holding)
Promoters
None
Held by 8 Schemes (7.4%)
Held by 42 FIIs (2.32%)
Shantaben P Jain (49.92%)
Bandhan Small Cap Fund (2.71%)
12.16%
Quarterly Results Snapshot (Consolidated) - Mar'26 - YoY

YoY Growth in quarter ended Mar 2026 is 12.38% vs 31.31% in Mar 2025

YoY Growth in quarter ended Mar 2026 is 6.42% vs -23.04% in Mar 2025
Half Yearly Results Snapshot (Consolidated) - Sep'25
Growth in half year ended Sep 2025 is 27.94% vs 4.22% in Sep 2024
Growth in half year ended Sep 2025 is -16.03% vs 8.85% in Sep 2024
Nine Monthly Results Snapshot (Consolidated) - Dec'25
YoY Growth in nine months ended Dec 2025 is 24.39% vs 11.47% in Dec 2024
YoY Growth in nine months ended Dec 2025 is -4.33% vs -1.08% in Dec 2024
Annual Results Snapshot (Consolidated) - Mar'26
YoY Growth in year ended Mar 2026 is 20.94% vs 16.53% in Mar 2025
YoY Growth in year ended Mar 2026 is -1.79% vs -6.22% in Mar 2025
About Kewal Kiran Clothing Ltd

Company Coordinates


