
Compare KFin Technolog. with Similar Stocks
Stock DNA
Capital Markets
INR 16,173 Cr (Small Cap)
42.00
21
1.40%
0.03
21.10%
8.86
Total Returns (Price + Dividend) 
Latest dividend: 11.939259094448772 per share ex-dividend date: Jul-15-2026
Risk Adjusted Returns v/s
Returns Beta

News
KFin Technologies Ltd Sees Sharp Open Interest Surge Amid Strong Market Outperformance
KFin Technologies Ltd (KFINTECH) witnessed a significant surge in open interest (OI) in its derivatives segment on 27 Jul 2026, signalling a notable shift in market positioning. The stock outperformed its sector and broader indices, with a strong intraday rally accompanied by increased volumes and delivery participation, suggesting renewed investor interest and potential directional bets.
Read full news article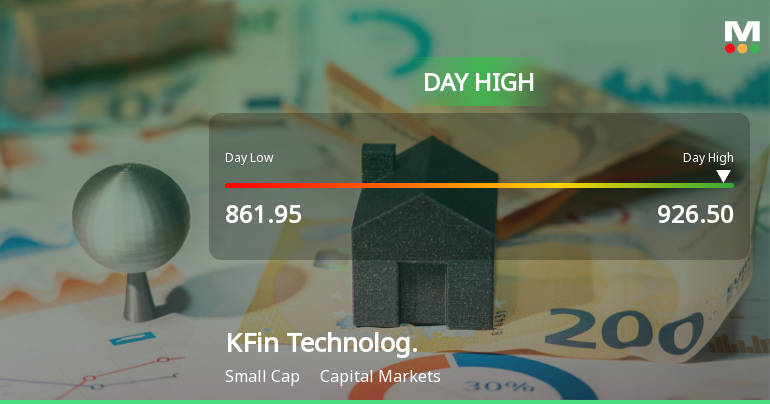
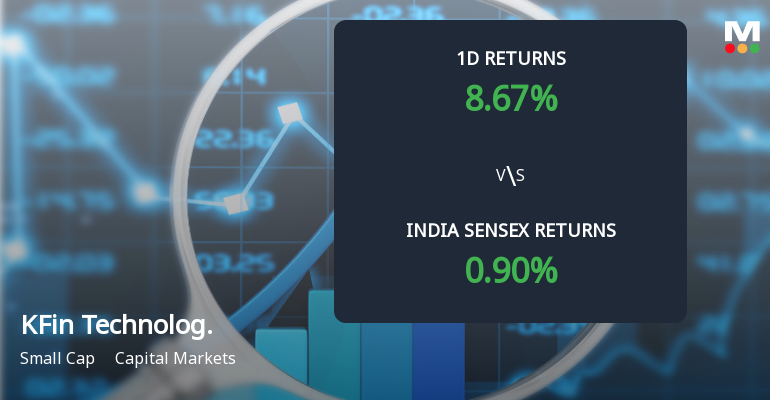
KFin Technologies Ltd Surges 7.27% to Day's High of Rs 922 — Outperforms Sector by 5.87 Percentage Points
The Sensex advanced 0.89% on 27 Jul 2026, yet KFin Technologies Ltd outpaced the broader market with a robust 7.27% gain, reaching an intraday high of Rs 922. This 5.87-percentage-point outperformance over its Capital Markets sector peers signals a distinctly stock-specific rally rather than a market-wide lift.
Read full news article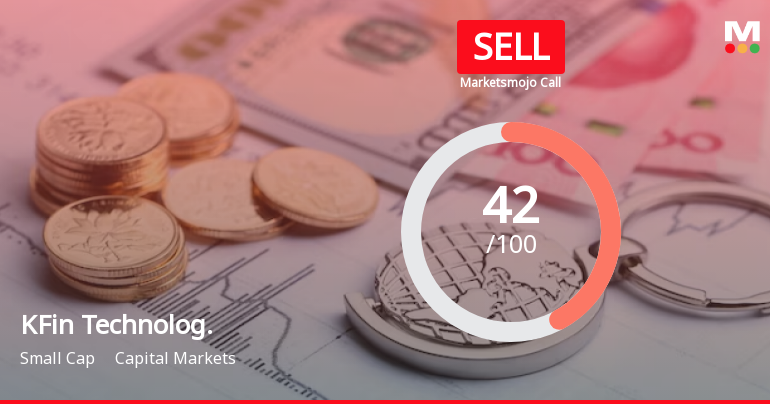
KFin Technologies Ltd is Rated Sell
KFin Technologies Ltd is rated 'Sell' by MarketsMOJO, with this rating last updated on 01 September 2025. However, the analysis and financial metrics discussed here reflect the stock's current position as of 27 July 2026, providing investors with an up-to-date view of the company’s performance and outlook.
Read full news article Announcements
Announcement under Regulation 30 (LODR)-Newspaper Publication
25-Jul-2026 | Source : BSEPlease find attached extract of unaudited consolidated financial results for the quarter ended June 30 2026 published in the newspapers today
Standalone And Consolidated Unaudited Financial Results
24-Jul-2026 | Source : BSEPlease find attached Standalone and Consolidated Unaudited Financial Results for the quarter ended June 30 2026
Announcement under Regulation 30 (LODR)-Investor Presentation
24-Jul-2026 | Source : BSEPlease find attached Investor Presentation and Factsheet on performance of the Company for the quarter ended June 30 2026
Corporate Actions

No Upcoming Board Meetings

KFin Technologies Ltd has declared 120% dividend, ex-date: 15 Jul 26

No Splits history available

No Bonus history available

No Rights history available
Quality key factors
Valuation key factors
Technicals key factors
 Technical Indicator Scale: Bearish, Mildly Bearish, Sideways, Mildly Bullish, Bullish Turned
 Shareholding Snapshot : Jun 2026
Shareholding Compare (%holding)
Non Institution
None
Held by 33 Schemes (16.74%)
Held by 164 FIIs (20.73%)
General Atlantic Singapore Fund Pte. Ltd. (21.89%)
Compar Estates And Agencies Private Limited (10.65%)
15.01%
Quarterly Results Snapshot (Consolidated) - Jun'26 - QoQ

QoQ Growth in quarter ended Jun 2026 is 2.65% vs -6.35% in Mar 2026
QoQ Growth in quarter ended Jun 2026 is -7.32% vs -11.78% in Mar 2026
Half Yearly Results Snapshot (Consolidated) - Sep'25

Growth in half year ended Sep 2025 is 12.60% vs 32.67% in Sep 2024
Growth in half year ended Sep 2025 is 8.37% vs 50.25% in Sep 2024
Nine Monthly Results Snapshot (Consolidated) - Dec'25
YoY Growth in nine months ended Dec 2025 is 18.08% vs 32.64% in Dec 2024
YoY Growth in nine months ended Dec 2025 is 6.05% vs 44.29% in Dec 2024
Annual Results Snapshot (Consolidated) - Mar'26
YoY Growth in year ended Mar 2026 is 19.32% vs 30.23% in Mar 2025
YoY Growth in year ended Mar 2026 is 3.33% vs 35.19% in Mar 2025
About KFin Technologies Ltd

Company Coordinates


