
Compare KFin Technolog. with Similar Stocks
Stock DNA
Capital Markets
INR 15,503 Cr (Small Cap)
45.00
21
0.00%
0.03
21.10%
9.39
Total Returns (Price + Dividend) 
Latest dividend: 5.7 per share ex-dividend date: Aug-23-2024
Risk Adjusted Returns v/s
Returns Beta

News

KFin Technologies Ltd Sees Sharp Open Interest Surge Amid Bullish Momentum
KFin Technologies Ltd (KFINTECH) has witnessed a significant surge in open interest (OI) in its derivatives segment, signalling heightened market activity and shifting investor positioning. The stock’s recent outperformance, coupled with a 14.9% increase in OI, suggests growing directional bets amid a backdrop of sustained gains and evolving volume patterns.
Read full news article
KFin Technologies Ltd Sees Sharp Open Interest Surge Amid Bullish Momentum
KFin Technologies Ltd (KFINTECH) has witnessed a significant surge in open interest in its derivatives segment, signalling heightened market activity and shifting investor positioning. The stock has outperformed its sector peers with a 3.97% gain today, reflecting growing bullish sentiment despite a recent downgrade in its Mojo Grade to Sell.
Read full news article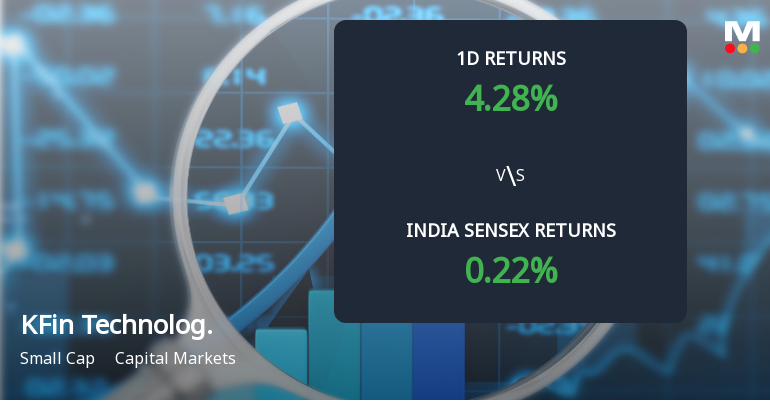
KFin Technologies Ltd Sees Sharp Open Interest Surge Amidst Bullish Momentum
KFin Technologies Ltd (KFINTECH) has witnessed a notable surge in open interest in its derivatives segment, signalling increased market participation and shifting positioning among traders. The stock has outperformed its sector peers with a 4.15% gain today, supported by a four-day consecutive rally that has delivered nearly 10% returns, reflecting growing bullish sentiment despite mixed technical indicators.
Read full news article Announcements
Announcement under Regulation 30 (LODR)-Newspaper Publication
17-Jun-2026 | Source : BSEPlease find attached the information regarding 9th Annual General Meeting to be held through video conferencing / other audio- visual means published in the newspapers today
Intimation Of Schedule Of Analyst / Institutional Investors Meet
17-Jun-2026 | Source : BSEPlease find attached Intimation of Schedule of Analyst / Institutional Investors Meet
Intimation Of Schedule Of Analyst / Institutional Investors Meet
15-Jun-2026 | Source : BSEPlease find attached Intimation of Schedule of Analyst / Institutional Investors Meet
Corporate Actions

No Upcoming Board Meetings

KFin Technologies Ltd has declared 120% dividend, ex-date: 15 Jul 26

No Splits history available

No Bonus history available

No Rights history available
Quality key factors
Valuation key factors
Technicals key factors
 Technical Indicator Scale: Bearish, Mildly Bearish, Sideways, Mildly Bullish, Bullish Turned
 Shareholding Snapshot : Mar 2026
Shareholding Compare (%holding)
FIIs
None
Held by 28 Schemes (13.11%)
Held by 197 FIIs (26.26%)
General Atlantic Singapore Fund Pte. Ltd. (21.93%)
Compar Estates And Agencies Private Limited (10.67%)
12.0%
Quarterly Results Snapshot (Consolidated) - Mar'26 - QoQ

QoQ Growth in quarter ended Mar 2026 is -6.35% vs 19.93% in Dec 2025
QoQ Growth in quarter ended Mar 2026 is -11.78% vs -1.41% in Dec 2025
Half Yearly Results Snapshot (Consolidated) - Sep'25
Growth in half year ended Sep 2025 is 12.60% vs 32.67% in Sep 2024
Growth in half year ended Sep 2025 is 8.37% vs 50.25% in Sep 2024
Nine Monthly Results Snapshot (Consolidated) - Dec'25
YoY Growth in nine months ended Dec 2025 is 18.08% vs 32.64% in Dec 2024
YoY Growth in nine months ended Dec 2025 is 6.05% vs 44.29% in Dec 2024
Annual Results Snapshot (Consolidated) - Mar'26
YoY Growth in year ended Mar 2026 is 19.32% vs 30.23% in Mar 2025
YoY Growth in year ended Mar 2026 is 3.33% vs 35.19% in Mar 2025
About KFin Technologies Ltd

Company Coordinates


