
Compare KG Petrochem with Similar Stocks
Dashboard
Weak Long Term Fundamental Strength with a -25.41% CAGR growth in Operating Profits over the last 5 years
- Low ability to service debt as the company has a high Debt to EBITDA ratio of 4.66 times
- The company has been able to generate a Return on Equity (avg) of 4.22% signifying low profitability per unit of shareholders funds
The company has declared Negative results for the last 3 consecutive quarters
Stock DNA
Garments & Apparels
INR 92 Cr (Micro Cap)
21.00
14
0.00%
0.44
2.39%
0.49
Total Returns (Price + Dividend) 
KG Petrochem for the last several years.
Risk Adjusted Returns v/s
Returns Beta

News
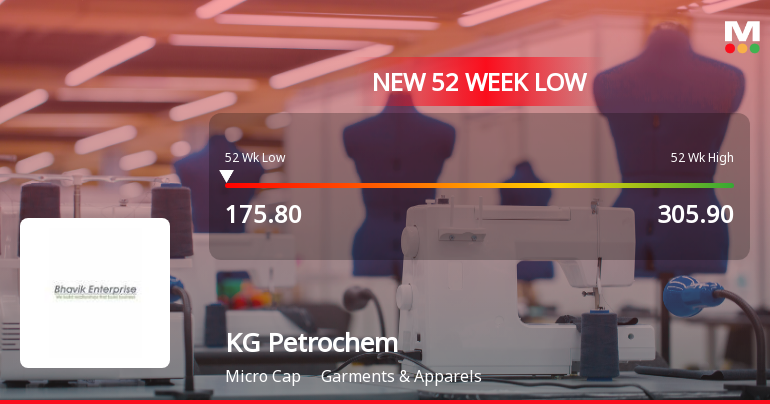
Markets Rally, But KG Petrochem Ltd Sinks to 52-Week Low in Stock-Specific Sell-Off
Despite a broadly positive market environment, KG Petrochem Ltd has plunged to a fresh 52-week low of Rs 175.8 on 8 Jun 2026, marking a stark divergence from the broader indices. The stock’s decline today by 5.00% underperformed its sector by over 3%, reflecting persistent headwinds that have weighed heavily on investor sentiment.
Read full news article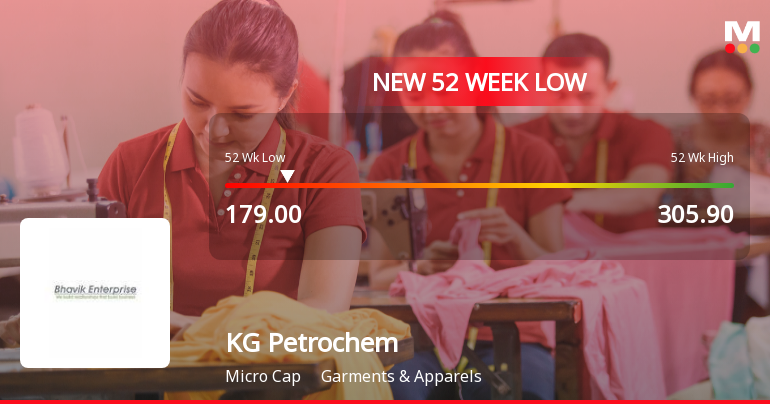
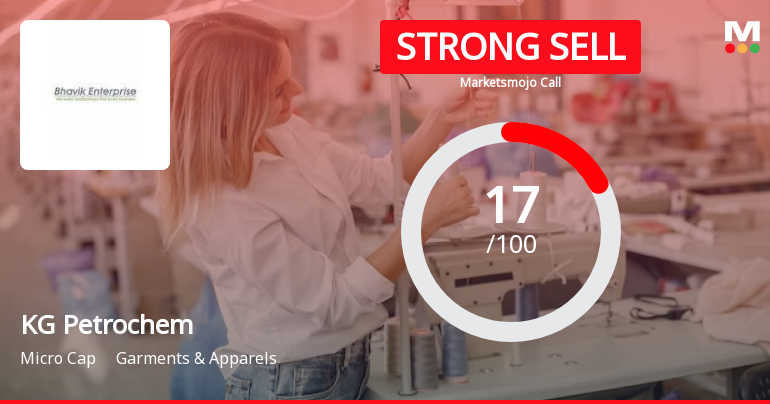
KG Petrochem Ltd is Rated Strong Sell
KG Petrochem Ltd is rated Strong Sell by MarketsMOJO. This rating was last updated on 29 May 2026. However, the analysis and financial metrics discussed below reflect the stock’s current position as of 04 June 2026, providing investors with the latest insights into the company’s performance and outlook.
Read full news article Announcements
Announcement under Regulation 30 (LODR)-Newspaper Publication
29-May-2026 | Source : BSEIntimation of Newspaper Publication of Standalone Financial Results for the Quarter and Year ended 31-03-2026
Announcement under Regulation 30 (LODR)-Change in Directorate
27-May-2026 | Source : BSEPlease find attached the intimation of Appointment of Mr. Anjal Kejriwal as an Additional Director as Non-Executive - Independent Director and resignation of Mrs. Vani Jain from the post of Independent Director of the company.
Board Meeting Outcome for Outcome Of Board Meeting Held On May 27 2026
27-May-2026 | Source : BSEPlease find attached outcome of Board meeting held on may 27 2026
Corporate Actions

No Upcoming Board Meetings

No Dividend history available

No Splits history available

No Bonus history available

No Rights history available
Quality key factors
Valuation key factors
Technicals key factors
 Technical Indicator Scale: Bearish, Mildly Bearish, Sideways, Mildly Bullish, Bullish Turned
 Shareholding Snapshot : Mar 2026
Shareholding Compare (%holding)
Promoters
None
Held by 0 Schemes
Held by 0 FIIs
Manish Singhal (27.67%)
Sanjay Bansal (4.98%)
20.26%
Quarterly Results Snapshot (Standalone) - Mar'26 - YoY

YoY Growth in quarter ended Mar 2026 is -34.87% vs 18.32% in Mar 2025

YoY Growth in quarter ended Mar 2026 is 235.14% vs -14.94% in Mar 2025
Half Yearly Results Snapshot (Standalone) - Sep'25
Growth in half year ended Sep 2025 is 22.33% vs -5.95% in Sep 2024
Growth in half year ended Sep 2025 is 3.19% vs 186.24% in Sep 2024
Nine Monthly Results Snapshot (Standalone) - Dec'25
YoY Growth in nine months ended Dec 2025 is -7.30% vs 11.22% in Dec 2024
YoY Growth in nine months ended Dec 2025 is -57.73% vs 6,557.14% in Dec 2024
Annual Results Snapshot (Standalone) - Mar'26
YoY Growth in year ended Mar 2026 is -16.44% vs 13.48% in Mar 2025
YoY Growth in year ended Mar 2026 is -19.24% vs 492.47% in Mar 2025
About KG Petrochem Ltd

Company Coordinates


