
Compare Kilburn Engg. with Similar Stocks
Dashboard
With ROE of 14.7, it has a Very Expensive valuation with a 3.9 Price to Book Value
- The stock is trading at a premium compared to its peers' average historical valuations
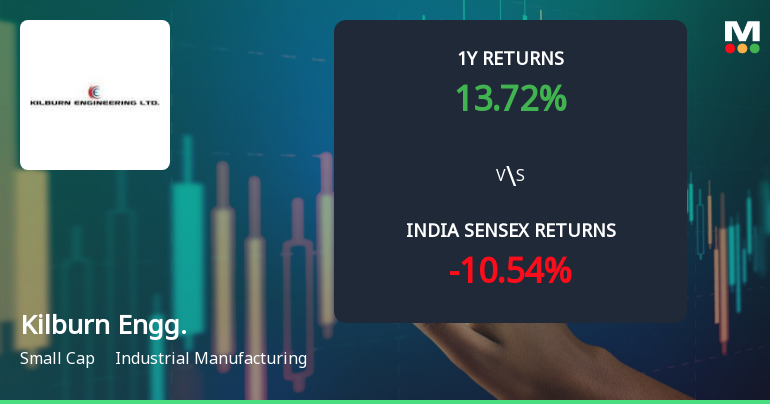
- Over the past year, while the stock has generated a return of 10.53%, its profits have risen by 54% ; the PEG ratio of the company is 0.6
Stock DNA
Industrial Manufacturing
INR 2,619 Cr (Small Cap)
27.00
36
0.40%
0.03
14.71%
3.97
Total Returns (Price + Dividend) 
Latest dividend: 2 per share ex-dividend date: Sep-18-2025
Risk Adjusted Returns v/s
Returns Beta

News
Kilburn Engineering Ltd Faces Bearish Momentum Amid Technical Downgrade
Kilburn Engineering Ltd, a small-cap player in the industrial manufacturing sector, has seen a notable shift in its technical momentum, with key indicators signalling a bearish trend. The company’s MarketsMOJO grade was downgraded from Hold to Sell on 25 May 2026, reflecting deteriorating technical conditions amid a 1.45% decline in the stock price on 9 June 2026.
Read full news article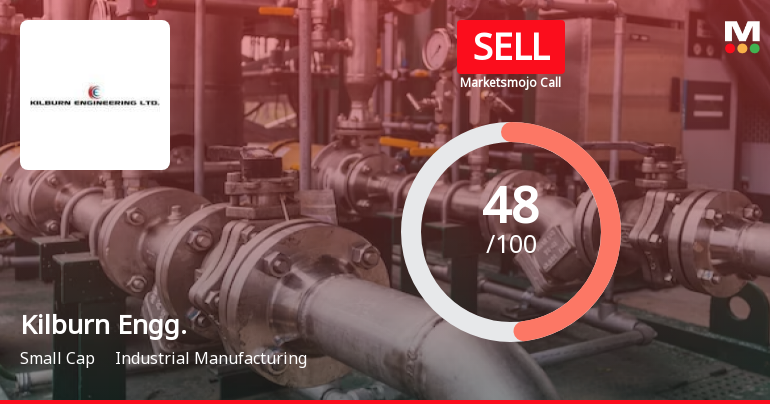
Kilburn Engineering Ltd is Rated Sell
Kilburn Engineering Ltd is rated 'Sell' by MarketsMOJO, with this rating last updated on 25 May 2026. However, the analysis and financial metrics discussed below reflect the stock's current position as of 08 June 2026, providing investors with an up-to-date view of the company’s fundamentals, valuation, financial trends, and technical outlook.
Read full news article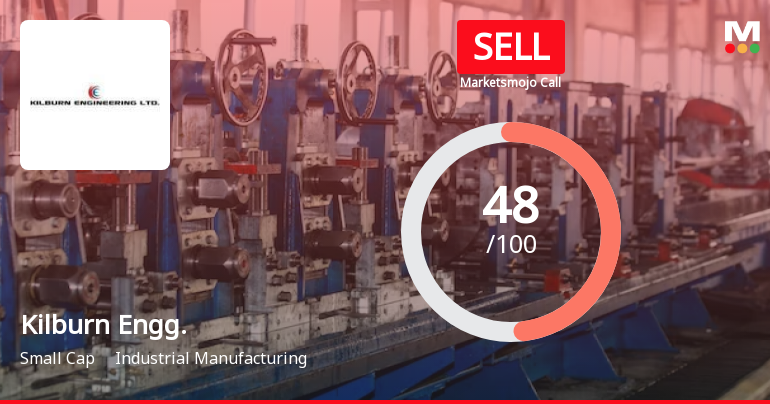
Kilburn Engineering Ltd is Rated Sell by MarketsMOJO
Kilburn Engineering Ltd is rated 'Sell' by MarketsMOJO, with this rating last updated on 25 May 2026. However, the analysis and data presented here reflect the stock's current position as of 08 June 2026, providing investors with an up-to-date view of its fundamentals, returns, and financial metrics.
Read full news article Announcements
Announcement under Regulation 30 (LODR)-Newspaper Publication
06-Jun-2026 | Source : BSEPursuant to Regulation 30 and 47 of the Securities and Exchange Board of India (Listing Obligations and Disclosure Requirements) Regulations 2015 we hereby enclose copies of the newspaper advertisements informing the shareholders regarding transfer of Equity Shares of the Company in respect of which dividend has not been claimed for seven consecutive years from F.Y. 2018-19 to Investor Education and Protection Fund (IEPF) Authority. The said newspaper advertisements were published on June 6 2026 in accordance with the requirements of Section 124(6) of the Companies Act 2013 read with IEPF Authority (Accounting Audit Transfer and Refund) Rules 2016 as amended from time to time. in the following editions: 1. Business Standard (English - All Edition) and 2. Duranta Barta (Bengali Edition)
Reminder Letter Dispatched To Shareholders For Transfer Of Equity Shares Of The Company To IEPF
06-Jun-2026 | Source : BSEIn terms of Regulation 30 and other applicable provisions of the SEBI (Listing Obligations and Disclosure Requirements) Regulations 2015 we would like to inform you that the Company has dispatched reminder letters to the identified shareholders who have not claimed their dividends for seven or more consecutive years and whose equity shares are consequently liable to be transferred to the Investor Education and Protection Fund (IEPF) Authority in terms of Section 124(6) of the Companies Act 2013 read with the Investor Education and Protection Fund Authority (Accounting Audit Transfer and Refund) Rules 2016 as amended.
Announcement under Regulation 30 (LODR)-Analyst / Investor Meet - Intimation
02-Jun-2026 | Source : BSEPease find the intimation for proposed physical Group meeting with analysts/investors scheduled to be held on 05th June 2026.
Corporate Actions

No Upcoming Board Meetings

Kilburn Engineering Ltd has declared 20% dividend, ex-date: 18 Sep 25

No Splits history available

No Bonus history available

Kilburn Engineering Ltd has announced 1:1 rights issue, ex-date: 27 Jan 06
Quality key factors
Valuation key factors
Technicals key factors
 Technical Indicator Scale: Bearish, Mildly Bearish, Sideways, Mildly Bullish, Bullish Turned
 Shareholding Snapshot : May 2026
Shareholding Compare (%holding)
Non Institution
17.3185
Held by 4 Schemes (5.87%)
Held by 5 FIIs (1.1%)
Firstview Trading Private Limited (29.27%)
Procheta Consultants Private Limited (12.52%)
18.74%
Quarterly Results Snapshot (Consolidated) - Mar'26 - YoY

YoY Growth in quarter ended Mar 2026 is 49.03% vs 4.46% in Mar 2025
YoY Growth in quarter ended Mar 2026 is 21.80% vs -11.68% in Mar 2025
Half Yearly Results Snapshot (Standalone) - Sep'25
Growth in half year ended Sep 2025 is 47.45% vs 5.11% in Sep 2024

Growth in half year ended Sep 2025 is 33.33% vs 43.34% in Sep 2024
Nine Monthly Results Snapshot (Standalone) - Dec'25
YoY Growth in nine months ended Dec 2025 is 34.97% vs 12.12% in Dec 2024
YoY Growth in nine months ended Dec 2025 is 23.50% vs 40.52% in Dec 2024
Annual Results Snapshot (Consolidated) - Mar'26
YoY Growth in year ended Mar 2026 is 48.14% vs 28.83% in Mar 2025
YoY Growth in year ended Mar 2026 is 54.44% vs 23.25% in Mar 2025
About Kilburn Engineering Ltd

Company Coordinates


