
Compare Kinetic Engg. with Similar Stocks
Dashboard
Weak Long Term Fundamental Strength with a -187.79% CAGR growth in Operating Profits over the last 5 years
- Company's ability to service its debt is weak with a poor EBIT to Interest (avg) ratio of -0.09
- The company has been able to generate a Return on Equity (avg) of 5.28% signifying low profitability per unit of shareholders funds
Flat results in Mar 26
Risky - Negative Operating Profits
Stock DNA
Auto Components & Equipments
INR 545 Cr (Micro Cap)
300.00
35
0.00%
0.21
1.20%
3.61
Total Returns (Price + Dividend) 
Kinetic Engg. for the last several years.
Risk Adjusted Returns v/s
Returns Beta

News
Are Kinetic Engineering Ltd latest results good or bad?
Kinetic Engineering Ltd's latest financial results present a complex picture for stakeholders. In the quarter ending March 2026, the company reported a net profit of ₹0.27 crores, reflecting a 35.00% increase compared to the previous quarter. However, this figure represents a significant decline of 56.45% year-on-year, raising concerns about the sustainability of profit generation. On the revenue front, Kinetic Engineering achieved ₹44.73 crores, marking a 16.58% increase from the previous quarter and a 16.06% rise year-on-year, which is the highest quarterly sales figure in recent periods. The operating margin improved to 7.73%, up from 5.28% in the prior quarter, indicating better cost management practices. Despite these positive revenue trends, the company's reliance on other income to support profitability is notable, with ₹0.93 crores contributing to the net profit in Q4 FY26. This raises questions...
Read full news article
Kinetic Engineering Ltd is Rated Strong Sell
Kinetic Engineering Ltd is rated Strong Sell by MarketsMOJO, with this rating last updated on 04 March 2026. However, the analysis and financial metrics discussed here reflect the company’s current position as of 01 June 2026, providing investors with the latest insights into its performance and outlook.
Read full news article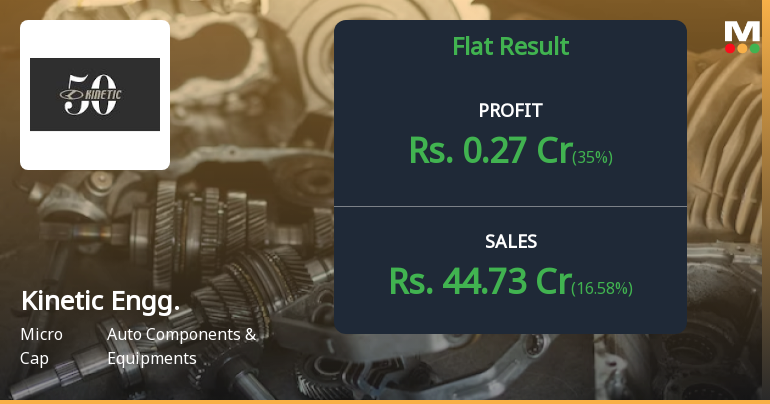
Kinetic Engineering Q4 FY26: Profitability Rebounds but Valuation Concerns Persist
Kinetic Engineering Ltd., the Pune-based automotive components manufacturer, reported a consolidated net profit of ₹0.27 crores for Q4 FY26, marking a 35.00% sequential improvement from Q3 FY26's ₹0.20 crores. However, the year-on-year comparison reveals a concerning 56.45% decline from Q4 FY25's ₹0.62 crores, underscoring the challenges facing this micro-cap player in India's competitive auto components sector. With a market capitalisation of ₹538.13 crores and shares trading at ₹226.00, the stock has declined 35.07% year-to-date, significantly underperforming the Sensex's 12.28% fall during the same period.
Read full news article Announcements
Announcement under Regulation 30 (LODR)-Newspaper Publication
31-May-2026 | Source : BSEExtract of Audited Financial Results - March 31 2026.
Compliances-Reg.24(A)-Annual Secretarial Compliance
30-May-2026 | Source : BSEAnnual Secretarial Compliance Report for F.Y. 2025-26.
Meeting Held On May 29 2026.
29-May-2026 | Source : BSEOutcome of Board Meeting held on May 29 2026 for approval of Audited Results for quarter and year ended March 31 2026.
Corporate Actions

No Upcoming Board Meetings

No Dividend history available

No Splits history available

No Bonus history available

No Rights history available
Quality key factors
Valuation key factors
Technicals key factors
 Technical Indicator Scale: Bearish, Mildly Bearish, Sideways, Mildly Bullish, Bullish Turned
 Shareholding Snapshot : Mar 2026
Shareholding Compare (%holding)
Promoters
None
Held by 9 Schemes (0.0%)
Held by 4 FIIs (3.28%)
Micro Age Instruments Pvt Ltd (20.52%)
Ashoka Investment Holdings Limited (3.28%)
26.68%
Quarterly Results Snapshot (Consolidated) - Mar'26 - QoQ

QoQ Growth in quarter ended Mar 2026 is 16.58% vs -2.37% in Dec 2025

QoQ Growth in quarter ended Mar 2026 is 35.00% vs 385.71% in Dec 2025
Half Yearly Results Snapshot (Consolidated) - Sep'25
Growth in half year ended Sep 2025 is -0.51% vs 8.82% in Sep 2024
Growth in half year ended Sep 2025 is -79.03% vs -11.30% in Sep 2024
Nine Monthly Results Snapshot (Consolidated) - Dec'25
YoY Growth in nine months ended Dec 2025 is 8.75% vs 0.66% in Dec 2024
YoY Growth in nine months ended Dec 2025 is -86.90% vs 44.28% in Dec 2024
Annual Results Snapshot (Consolidated) - Mar'26
YoY Growth in year ended Mar 2026 is 10.73% vs -1.02% in Mar 2025
YoY Growth in year ended Mar 2026 is -83.96% vs 27.38% in Mar 2025
About Kinetic Engineering Ltd

Company Coordinates


