
Compare Kings Infra with Similar Stocks
Dashboard
Strong ability to service debt as the company has a low Debt to EBITDA ratio of 2.65 times
Healthy long term growth as Net Sales has grown by an annual rate of 38.23% and Operating profit at 40.99%
The company declared positive results in Mar'26 after flat results in Dec'25
With ROCE of 27, it has a Attractive valuation with a 3.2 Enterprise value to Capital Employed
Majority shareholders : Promoters
Consistent Underperformance against the benchmark over the last 3 years
Total Returns (Price + Dividend) 
Kings Infra for the last several years.
Risk Adjusted Returns v/s
Returns Beta

News
Kings Infra Ventures Ltd is Rated Hold by MarketsMOJO
Kings Infra Ventures Ltd is rated 'Hold' by MarketsMOJO, with this rating last updated on 25 May 2026. However, the analysis and financial metrics discussed here reflect the stock's current position as of 11 June 2026, providing investors with an up-to-date perspective on the company’s fundamentals, valuation, financial trends, and technical outlook.
Read full news article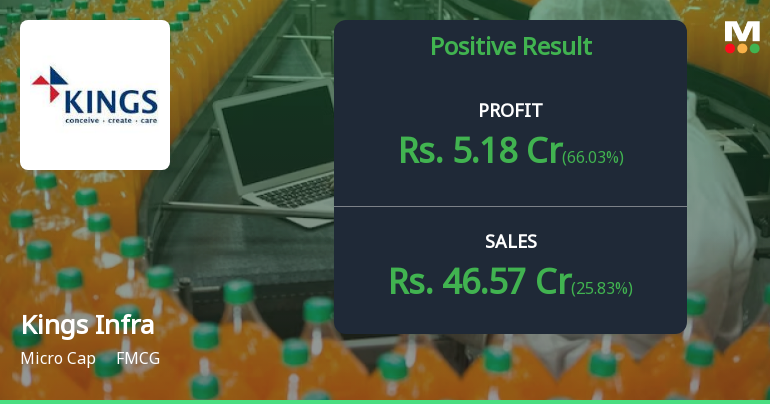
Kings Infra Ventures Q4 FY26: Strong Profit Surge Masks Underlying Concerns
Kings Infra Ventures Ltd., a micro-cap infrastructure and aquaculture company with a market capitalisation of ₹292.00 crores, reported a robust 90.44% year-on-year surge in consolidated net profit to ₹5.18 crores for the quarter ended March 2026 (Q4 FY26). However, the impressive headline numbers conceal deeper concerns about operational sustainability, with the stock trading 31.85% below its 52-week high and technical indicators flashing warning signals despite the strong quarterly performance.
Read full news article Announcements
Intimation Of Allotment Of Secured Redeemable Non-Convertible Debentures On Private Placement Basis
04-Jun-2026 | Source : BSEIntimation of allotment of Secured Redeemable Non-Convertible Debentures on Private Placement basis
PRESS RELEASE
01-Jun-2026 | Source : BSEPRESS RELEASE
Announcement under Regulation 30 (LODR)-Newspaper Publication
31-May-2026 | Source : BSENewspaper Advertisement of Published Financial Results
Corporate Actions

No Upcoming Board Meetings

No Dividend history available

No Splits history available

No Bonus history available

No Rights history available
Quality key factors
Valuation key factors
Technicals key factors
 Technical Indicator Scale: Bearish, Mildly Bearish, Sideways, Mildly Bullish, Bullish Turned
 Shareholding Snapshot : Mar 2026
Shareholding Compare (%holding)
Promoters
None
Held by 0 Schemes
Held by 0 FIIs
Shaji Baby John (20.23%)
Sushil Lahoti (1.65%)
25.09%
Quarterly Results Snapshot (Consolidated) - Mar'26 - QoQ

QoQ Growth in quarter ended Mar 2026 is 25.83% vs -14.19% in Dec 2025
QoQ Growth in quarter ended Mar 2026 is 66.03% vs -27.44% in Dec 2025
Half Yearly Results Snapshot (Consolidated) - Sep'25

Growth in half year ended Sep 2025 is 31.96% vs 38.78% in Sep 2024
Growth in half year ended Sep 2025 is 23.23% vs 47.45% in Sep 2024
Nine Monthly Results Snapshot (Consolidated) - Dec'25
YoY Growth in nine months ended Dec 2025 is 24.23% vs 41.51% in Dec 2024
YoY Growth in nine months ended Dec 2025 is 6.71% vs 77.85% in Dec 2024
Annual Results Snapshot (Consolidated) - Mar'26
YoY Growth in year ended Mar 2026 is 29.90% vs 36.95% in Mar 2025
YoY Growth in year ended Mar 2026 is 24.14% vs 70.29% in Mar 2025
About Kings Infra Ventures Ltd

Company Coordinates


