
Compare Kiri Industries with Similar Stocks
Dashboard
With a Operating Losses, the company has a Weak Long Term Fundamental Strength
- Company's ability to service its debt is weak with a poor EBIT to Interest (avg) ratio of -0.82
- The company has been able to generate a Return on Equity (avg) of 8.02% signifying low profitability per unit of shareholders funds
Risky - Negative EBITDA
Underperformed the market in the last 1 year
Stock DNA
Dyes And Pigments
INR 2,621 Cr (Small Cap)
5.00
20
0.00%
-0.63
7.85%
0.40
Total Returns (Price + Dividend) 
Latest dividend: 0.5 per share ex-dividend date: Sep-17-2020
Risk Adjusted Returns v/s
Returns Beta

News
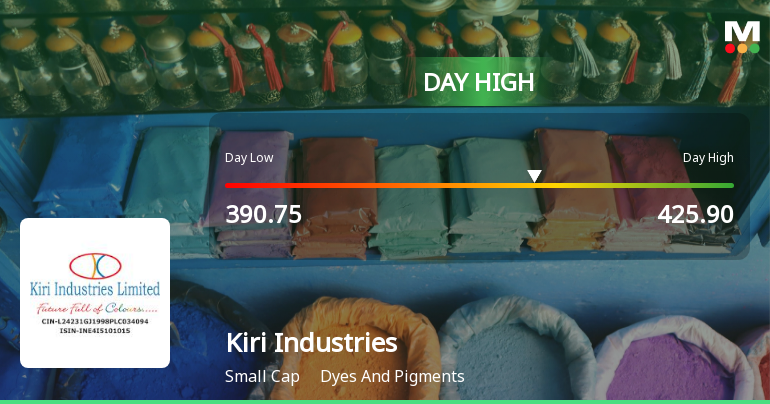
Kiri Industries Ltd Surges 7.09% to Day's High of Rs 403.35 — Outperforms Sector by 3.14 Percentage Points
The Sensex declined nearly 1% on 8 Jun 2026, yet Kiri Industries Ltd surged 7.09%, marking a notable 3.14 percentage-point outperformance over its sector peers. This sharp intraday gain rewrites the short-term narrative for the small-cap dyes and pigments company, raising the question of whether this is a genuine recovery or a technical bounce within a broader downtrend.
Read full news article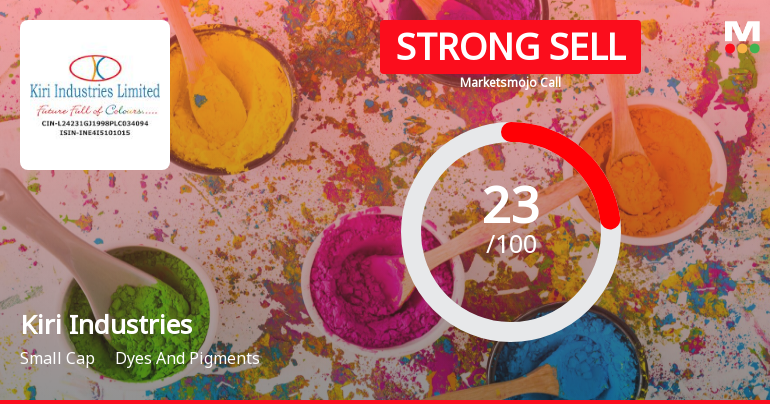
Kiri Industries Ltd is Rated Strong Sell
Kiri Industries Ltd is rated Strong Sell by MarketsMOJO, with this rating last updated on 02 June 2025. However, the analysis and financial metrics discussed here reflect the company’s current position as of 03 June 2026, providing investors with the most up-to-date insight into the stock’s fundamentals, valuation, financial trends, and technical outlook.
Read full news articleAre Kiri Industries Ltd latest results good or bad?
Kiri Industries Ltd's latest financial results for Q4 FY26 present a complex picture characterized by significant operational challenges despite some surface-level revenue growth. The company reported consolidated net sales of ₹250.50 crores, which marks a 44.31% increase quarter-on-quarter and a 22.18% increase year-on-year, indicating a potential recovery in demand for its products. However, this growth is overshadowed by a substantial operational loss, with the operating profit before depreciation, interest, and tax (excluding other income) plummeting to a negative ₹142.37 crores, resulting in an operating margin of -56.83%. This margin represents the lowest performance in eight quarters and highlights a critical breakdown in the company's operational economics. The consolidated net profit of ₹514.36 crores reflects a drastic decline of 89.76% compared to the previous quarter, primarily due to the relia...
Read full news article Announcements
Announcement under Regulation 30 (LODR)-Earnings Call Transcript
03-Jun-2026 | Source : BSEPlease find enclosed herewith Transcript of Q4-FY26/FY26 Earnings Conference Call held on Monday June 01 2026.
Announcement under Regulation 30 (LODR)-Analyst / Investor Meet - Outcome
01-Jun-2026 | Source : BSEPursuant to Regulation 30 of the SEBI (Listing Obligations and Disclosure Requirements) Regulations 2015 please find below the link of audio recording of Earnings Conference Call with Investors/ General Public held on Monday June 01 2026 at 10:30 AM (IST) on Group meet basis for discussion of Q4-FY26/FY26 results of the Company: Link: https://kiriindustries.com/wp-content/uploads/2026/06/Concall-KIRI-INDUSTRIES-LTD-01062026.mp3 You are kindly requested to take note of the same.
Announcement under Regulation 30 (LODR)-Change in Management
30-May-2026 | Source : BSEIntimation of Appointment of Internal Auditor for FY 2026-27.
Corporate Actions

No Upcoming Board Meetings

Kiri Industries Ltd has declared 5% dividend, ex-date: 17 Sep 20

No Splits history available

No Bonus history available

No Rights history available
Quality key factors
Valuation key factors
Technicals key factors
 Technical Indicator Scale: Bearish, Mildly Bearish, Sideways, Mildly Bullish, Bullish Turned
 Shareholding Snapshot : Apr 2026
Shareholding Compare (%holding)
Promoters
0.2191
Held by 1 Schemes (0.0%)
Held by 46 FIIs (16.87%)
Anupama Manishkumar Kiri (14.58%)
Griffin Growth Fund Vcc (5.11%)
28.78%
Quarterly Results Snapshot (Consolidated) - Mar'26 - QoQ

QoQ Growth in quarter ended Mar 2026 is 44.31% vs -18.67% in Dec 2025

QoQ Growth in quarter ended Mar 2026 is -89.76% vs 25,457.30% in Dec 2025
Half Yearly Results Snapshot (Consolidated) - Sep'25
Growth in half year ended Sep 2025 is -22.67% vs 17.37% in Sep 2024
Growth in half year ended Sep 2025 is -81.21% vs 875.32% in Sep 2024
Nine Monthly Results Snapshot (Consolidated) - Dec'25
YoY Growth in nine months ended Dec 2025 is -17.72% vs 15.98% in Dec 2024
YoY Growth in nine months ended Dec 2025 is 1,406.29% vs 122.37% in Dec 2024
Annual Results Snapshot (Consolidated) - Mar'26
YoY Growth in year ended Mar 2026 is 13.46% vs 4.43% in Mar 2025
YoY Growth in year ended Mar 2026 is 2,002.80% vs 59.26% in Mar 2025
About Kiri Industries Ltd

Company Coordinates


