Kirl. Brothers

  • Market Cap: Small Cap
  • Industry: Compressors, Pumps & Diesel Engines
  • ISIN: INE732A01036
  • NSEID: KIRLOSBROS
  • BSEID: 500241
INR
1,768.80
41.45 (2.4%)
BSENSE

Sep 17, 03:30 PM

BSE+NSE Vol: 30.32 k

  • Price Points
  • Score
  • Mojo Parameters
  • Total Return
  • News and Corporate Actions
  • Key factors
  • Shareholding
  • Financials
  • CompanyCV
stock-summaryPrice Point
High/Low

1Day

52 Week

Valuation
Technical
Day's Volume

CASH

30.32 k (-37.75%) Volume

Shareholding (Jun 2026)

FII

6.41%

Held by 126 FIIs

DII

10.22%

Held by 15 DIIs

Promoter

65.95%

Why is Kirloskar Brothers Ltd falling/rising?

06-Sep-2026

As of 05-Sep, Kirloskar Brothers Ltd's stock price is at 1,860.50, reflecting a decline of 1.1%. The stock has underperformed against benchmarks and experienced reduced investor participation, indicating short-term weakness despite the company's strong fundamentals.

As of 05-Sep, Kirloskar Brothers Ltd's stock price is falling, currently at 1,860.50, which reflects a decrease of 20.75 or 1.1%. This decline can be attributed to several factors. Over the past week, the stock has underperformed the benchmark Sensex, with a drop of 2.83% compared to the Sensex's decline of 0.97%. Additionally, the stock has shown a negative performance of 1.69% over the past month, while the Sensex has decreased by 2.44%.<BR><BR>Today's performance indicates that the stock has underperformed its sector by 1.64%. Furthermore, there has been a notable decrease in investor participation, with delivery volume falling by 41.73% against the 5-day average, indicating reduced trading interest. Although the stock is currently above its 100-day and 200-day moving averages, it is below the 5-day, 20-day, and 50-day moving averages, suggesting a short-term weakness.<BR><BR>Despite these challenges, the company maintains a strong position with high management efficiency and a net-debt-free status, which could support its long-term stability. However, the immediate factors contributing to the stock's decline are the recent underperformance relative to benchmarks and reduced investor activity.

View full answer

Who are in the management team of Kirl. Brothers?

01-Sep-2026

The management team of Kirl. Brothers includes Sanjay Kirloskar (Chairman & Managing Director), Rama Kirloskar (Joint Managing Director), and several non-executive independent directors, such as M S Unnikrishnan and Shobinder Duggal, among others. This diverse team combines executive leadership with independent oversight.

The management team of Kirl. Brothers includes the following individuals:<BR><BR>1. **Sanjay Kirloskar** - Chairman & Managing Director<BR>2. **Alok Sanjay Kirloskar** - Non-Executive & Non-Independent Director<BR>3. **Rama Kirloskar** - Joint Managing Director<BR>4. **M S Unnikrishnan** - Non-Executive & Independent Director<BR>5. **Shrinivas V Dempo** - Non-Executive & Independent Director<BR>6. **Shobinder Duggal** - Non-Executive & Independent Director<BR>7. **Ramni Nirula** - Non-Executive & Independent Director<BR>8. **Amitava Mukherjee** - Non-Executive & Independent Director<BR>9. **Rekha Sethi** - Non-Executive & Independent Director<BR>10. **Vivek Pendharkar** - Non-Executive & Independent Director<BR>11. **Devang Trivedi** - Company Secretary & Compliance Officer<BR><BR>This team brings a mix of executive leadership and independent oversight to the company.

View full answer

What does Kirl. Brothers do?

01-Sep-2026

Kirloskar Brothers Ltd is a small-cap engineering company specializing in fluid-handling projects, particularly in compressors, pumps, and diesel engines. As of June 2026, it reported net sales of ₹1,105 Cr and a net profit of ₹67 Cr, with a market cap of ₹15,008 Cr.

Overview:<BR>Kirloskar Brothers Ltd is a pioneering industrial organization in the engineering sector, specializing in fluid-handling projects within the compressors, pumps, and diesel engines industry, classified as a small-cap company.<BR><BR>History:<BR>Incorporated on 15 January 1920, Kirloskar Brothers Ltd has maintained its status as a key player in the engineering sector. The latest quarterly results reported net sales and net profit for June 2026.<BR><BR>Financial Snapshot:<BR>- Net Sales: 1,105 Cr (Quarterly Results - Jun 2026)<BR>- Net Profit: 67 Cr (Quarterly Results - Jun 2026)<BR>- Market Cap: INR 15,008 Cr (Small Cap)<BR><BR>Key Metrics:<BR>- P/E: 37.00<BR>- Industry P/E: 34<BR>- Dividend Yield: 0.37%<BR>- Debt-Equity: -0.25<BR>- Return on Equity: 16.47%<BR>- Price to Book: 6.17<BR><BR>Contact Details:<BR>Address: Yamuna Survey No 98 (3-7), Baner Pune Maharashtra : 411045<BR>Tel: 020 6721 4444<BR>Email: secretarial@kbl.co.in<BR>Website: http://www.kirloskarpumps.com

View full answer

Who are the peers of the Kirl. Brothers?

01-Sep-2026

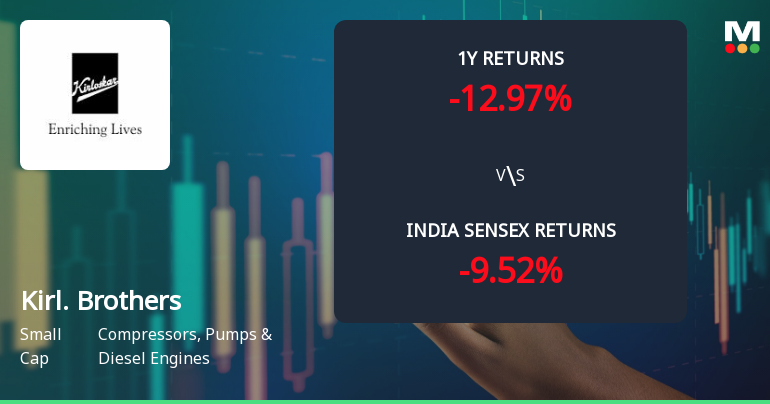
Peers of Kirl. Brothers include Cummins India, Kirloskar Oil, Elgi Equipments, and others. Kirl. Brothers has a Below Average growth rate and a 1-year return of -2.17%, better than Shakti Pumps but lower than Kirloskar Oil's 133.87%.

Peers: The peers of Kirl. Brothers are Cummins India, Kirloskar Oil, Elgi Equipments, Ingersoll-Rand, KSB, Kirl.Pneumatic, Shakti Pumps, Greaves Cotton, and Swaraj Engines.<BR><BR>Quality Snapshot: Excellent management risk is observed at Cummins India, Elgi Equipments, and Ingersoll-Rand, while Good management risk is found at Kirloskar Oil, Kirl. Brothers, KSB, Kirl.Pneumatic, Shakti Pumps, and Swaraj Engines, and Average management risk is noted at Greaves Cotton. Excellent growth is seen at Cummins India and Kirloskar Oil, while Average growth is found at Kirl.Pneumatic, Shakti Pumps, Elgi Equipments, and Ingersoll-Rand, and Below Average growth is noted at Kirl. Brothers, KSB, and Swaraj Engines. Excellent capital structure is present in Cummins India, Elgi Equipments, Ingersoll-Rand, Kirl. Brothers, KSB, Kirl.Pneumatic, and Shakti Pumps, while Below Average capital structure is observed at Kirloskar Oil.<BR><BR>Return Snapshot: Kirloskar Oil has the highest 1-year return at 133.87%, while Shakti Pumps has the lowest at -39.27%. Kirl. Brothers' 1-year return is -2.17%, which is better than Shakti Pumps but significantly lower than Kirloskar Oil. Additionally, Shakti Pumps and Swaraj Engines have negative six-month returns.

View full answer

How big is Kirl. Brothers?

01-Sep-2026

As of 31st August, Kirloskar Brothers Ltd has a market capitalization of 15,008.00 Cr, with net sales of 4,663.90 Cr and a net profit of 373.40 Cr reported in the latest four quarters. Shareholder's funds were 2,464.03 Cr, and total assets amounted to 4,370.20 Cr for the annual period ending in March 2026.

As of 31st August, Kirloskar Brothers Ltd has a market capitalization of 15,008.00 Cr, categorizing it as a Small Cap company.<BR><BR>In the latest four quarters, the company reported net sales of 4,663.90 Cr and a net profit of 373.40 Cr.<BR><BR>For the latest annual period ending in March 2026, the shareholder's funds were 2,464.03 Cr, and total assets amounted to 4,370.20 Cr.

View full answer

Should I buy, sell or hold Kirloskar Brothers Ltd?

01-Aug-2026

Are Kirloskar Brothers Ltd latest results good or bad?

14-May-2026

Kirloskar Brothers Ltd's latest results show strong sales growth with record net sales of ₹1,415.10 crore, but a significant decline in net profit and profit margins indicates operational challenges. Overall, the results are concerning due to the need for better cost management.

The latest results for Kirloskar Brothers Ltd present a mixed picture. On one hand, the company achieved record net sales of ₹1,415.10 crore in Q4 FY26, which reflects a strong growth of 26.78% quarter-on-quarter and 10.44% year-on-year. This indicates robust demand for its products in the fluid-handling sector.<BR><BR>However, the bottom line reveals significant challenges. The consolidated net profit for the quarter was ₹111.50 crore, which represents a decline of 10.30% sequentially and a more concerning drop of 18.67% year-on-year. Additionally, the operating margin decreased to 12.88%, down 191 basis points from the previous year, and the profit after tax (PAT) margin fell to 7.37%, down 228 basis points year-on-year. This margin compression raises concerns about the company's ability to manage costs effectively and maintain profitability in the face of rising input costs or pricing pressures.<BR><BR>Overall, while the sales figures are impressive, the declining profit margins and net profit suggest that the company is facing operational challenges that need to be addressed. Therefore, the latest results can be viewed as concerning, highlighting the need for improved cost management and operational efficiency.

View full answer

When is the next results date for Kirloskar Brothers Ltd?

07-May-2026

The next results date for Kirloskar Brothers Ltd is 13 May 2026.

The next results date for Kirloskar Brothers Ltd is scheduled for 13 May 2026.

View full answer

Is Kirl. Brothers overvalued or undervalued?

03-Dec-2025

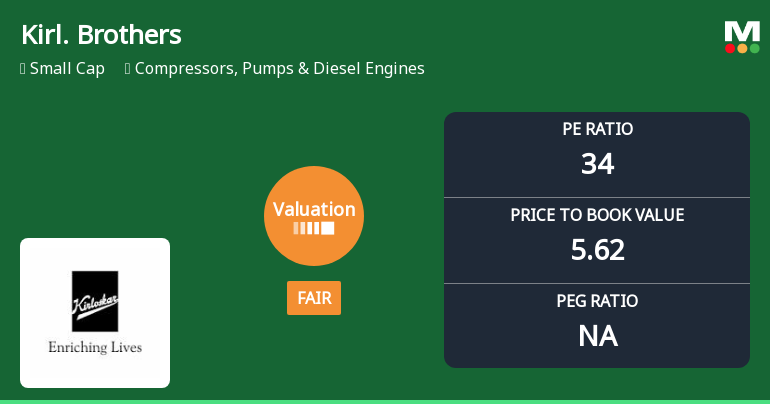
As of December 2, 2025, Kirl. Brothers is fairly valued with a PE ratio of 33.26 and an EV to EBITDA of 22.20, despite a year-to-date return of -19.82%, positioning it better than peers like Elgi Equipments and KSB, which are considered very expensive.

As of 2 December 2025, Kirl. Brothers has moved from an expensive to a fair valuation grade. The company is currently fairly valued, with a PE ratio of 33.26, an EV to EBITDA of 22.20, and a ROCE of 26.76%. In comparison to its peers, Kirl. Brothers stands out with a lower PE ratio than Elgi Equipments (41.1) and KSB (49.54), both of which are classified as very expensive.<BR><BR>Despite the recent decline in stock performance, with a year-to-date return of -19.82% compared to the Sensex's 8.96%, Kirl. Brothers' valuation metrics suggest it is positioned reasonably within its industry. The dividend yield of 0.42% and a ROE of 17.95% further support the notion that the company is fairly valued relative to its peers in the Compressors, Pumps & Diesel Engines sector.

View full answer

Is Kirl. Brothers technically bullish or bearish?

03-Dec-2025

As of December 2, 2025, the technical outlook for Kirl. Brothers has shifted to a bearish stance, supported by bearish indicators across MACD, Bollinger Bands, and moving averages, despite a mildly bullish signal from OBV.

As of 2 December 2025, the technical trend has changed from mildly bearish to bearish. The current technical stance is bearish with a strong indication of weakness. The weekly MACD is bearish, and both the weekly and monthly Bollinger Bands confirm a bearish outlook. Daily moving averages also reflect a bearish sentiment. The KST is bearish on the weekly and mildly bearish on the monthly, further supporting the bearish stance. Although the OBV shows a mildly bullish signal on the weekly, it does not outweigh the overall bearish indicators. The lack of clear trends in Dow Theory on both weekly and monthly time frames adds to the uncertainty. Overall, the combination of these indicators suggests a bearish market condition for Kirl. Brothers.

View full answer

How has been the historical performance of Kirl. Brothers?

03-Nov-2025

Kirl. Brothers has shown consistent growth, with net sales increasing from 3,135.40 Cr in March 2020 to 4,492.20 Cr in March 2025, and net profit rising to 415.20 Cr. The company has improved its operating profit and cash flow, reflecting strong financial performance and asset growth.

Answer:<BR>The historical performance of Kirl. Brothers shows a consistent growth trend in net sales and profits over the years, culminating in a net profit of 415.20 Cr for the year ending March 2025.<BR><BR>Breakdown:<BR>Kirl. Brothers has demonstrated a steady increase in net sales from 3,135.40 Cr in March 2020 to 4,492.20 Cr in March 2025. This growth is accompanied by a rise in total operating income, which reached 4,492.20 Cr in March 2025, reflecting a significant increase from 3,349.00 Cr in March 2019. The company's operating profit (PBDIT) also improved, reaching 681.10 Cr in March 2025, up from 151.40 Cr in March 2019. Profit before tax rose to 559.10 Cr in March 2025, compared to just 40.60 Cr in March 2019, while profit after tax increased to 403.40 Cr from a loss of 5.20 Cr in March 2019. The company's total assets grew to 3,628.82 Cr in March 2025, up from 2,815.86 Cr in March 2020, indicating a strong asset base. Total liabilities also increased to 3,628.82 Cr, reflecting the company's expanding operations. Cash flow from operating activities improved to 385.00 Cr in March 2025, highlighting effective cash management. Overall, Kirl. Brothers has shown robust financial growth and improved profitability over the years.

View full answer

Who are the top shareholders of the Kirl. Brothers?

17-Jul-2025

The top shareholders of Kirl. Brothers include Kirloskar Industries Ltd (23.91%), 17 mutual fund schemes (7.54%), 146 foreign institutional investors (6.1%), and Nippon Life India Trustee Ltd (5.67%), with individual investors holding 13.1% of the shares.

The top shareholders of Kirl. Brothers include several key players. The majority shareholder is Kirloskar Industries Ltd, which holds 23.91% of the shares. Additionally, there are 17 mutual fund schemes collectively holding 7.54%, and 146 foreign institutional investors (FIIs) with a combined holding of 6.1%. The highest public shareholder is Nippon Life India Trustee Ltd, representing the Nippon India Small Cap Fund, with a holding of 5.67%. Individual investors also have a significant presence, holding 13.1% of the shares.

View full answer

Has Kirl. Brothers declared dividend?

06-Jun-2025

Kirloskar Brothers Ltd has declared a 300% dividend, amounting to ₹6 per share, with an ex-date of July 26, 2024. While recent returns have varied, the company has shown significant long-term growth, particularly a 1590.82% price return over the past five years.

Kirloskar Brothers Ltd has declared a 300% dividend.<BR><BR>Dividend Details:<BR>- Percentage announced: 300%<BR>- Amount per share: 6<BR>- Ex-date: 26 Jul 24<BR><BR>Dividend Yield: 0.34%.<BR><BR>Total Returns by Period:<BR>In the last 6 months, the price return was -22.41%, with a dividend return of 0%, resulting in a total return of -22.41%.<BR><BR>Over the past year, the price return was 4.21%, the dividend return was 0.33%, leading to a total return of 4.54%.<BR><BR>In the 2-year period, the price return reached 196.79%, with a dividend return of 1.71%, culminating in a total return of 198.5%.<BR><BR>For the 3-year period, the price return was 570.53%, the dividend return was 4.49%, resulting in a total return of 575.02%.<BR><BR>In the last 4 years, the price return was 294.04%, with a dividend return of 4.02%, leading to a total return of 298.06%.<BR><BR>Over the past 5 years, the price return was an impressive 1590.82%, with a dividend return of 15.03%, resulting in a total return of 1605.85%.<BR><BR>Overall, Kirloskar Brothers Ltd has declared a significant dividend, and while the recent returns have been mixed, the long-term performance shows substantial growth, particularly in price returns over the last five years.

View full answer
iScoreScore
Click here to find our call on this stock
Strong Sell
Sell
Hold
Buy
Strong Buy

Dashboard

1

Poor long term growth as Net Sales has grown by an annual rate of 10.06% and Operating profit at 17.31% over the last 5 years

 
2

Flat results in Jun 26

3

Underperformed the market in the last 1 year

stock-summaryMojo Parameters

Mojo Parameters

Loading Valuation Snapshot...

Stock DNA

stock-summary
Industry

Compressors, Pumps & Diesel Engines

stock-summary
Market cap

INR 13,841 Cr (Small Cap)

stock-summary
P/E

34.00

stock-summary
Industry P/E

32

stock-summary
Dividend Yield

0.40%

stock-summary
Debt Equity

-0.25

stock-summary
Return on Equity

16.47%

stock-summary
Price to Book

5.57

Revenue and Profits:
Net Sales:
1,105 Cr
(Quarterly Results - Jun 2026)
Net Profit:
67 Cr
stock-summaryTotal Returns
Total Returns (Price + Dividend) stock-summary
Dividend Yield (0.4%)
TimePeriod
Price Return
Dividend Return
Total Return
3 Months
-4.24%
0.34%
-3.9%
6 Months
16.41%
0.47%
16.88%
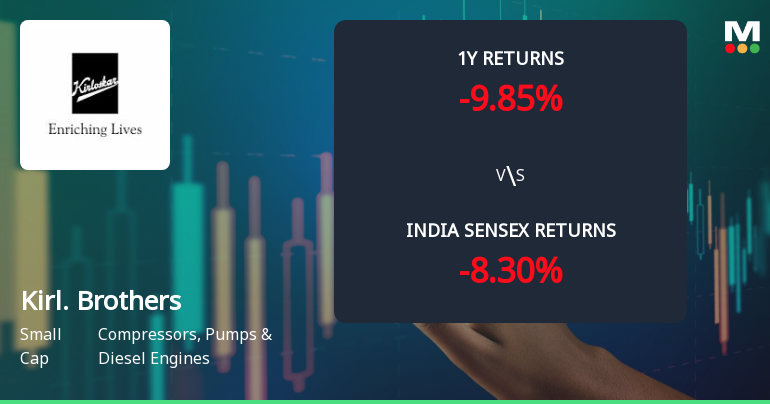
1 Year
-15.04%
0.35%
-14.69%
2 Years
9.6%
0.75%
10.35%
3 Years
116.82%
2.40%
119.22%
4 Years
429.5%
7.06%
436.56%
5 Years
382.09%
6.70%
388.79%

Latest dividend: 6.976043024771839 per share ex-dividend date: Jul-24-2026

Risk Adjusted Returns v/s stock-summary
Returns Beta
Icon
Beta has not been calculated since enough price history is not available
stock-summaryNews & Corporate Actions

News

Announcements stock-summary

Announcement under Regulation 30 (LODR)-Newspaper Publication

16-Sep-2026 | Source : BSE

Intimation under Regulation 30 of SEBI Listing Regulations 2015

Shareholder Meeting / Postal Ballot-Notice of Postal Ballot

15-Sep-2026 | Source : BSE

Intimation of Postal Ballot under Regulation 30 of the SEBI Listing Regulations 2015

Announcement under Regulation 30 (LODR)-Change in Management

07-Sep-2026 | Source : BSE

Intimation under Regulation 30 of the SEBI Listing Regulations 2015

Corporate Actions stock-summary

stock-summary
BOARD MEETING

No Upcoming Board Meetings

stock-summary
DIVIDEND

Kirloskar Brothers Ltd has declared 350% dividend, ex-date: 24 Jul 26

stock-summary
SPLITS

No Splits history available

stock-summary
BONUS

No Bonus history available

stock-summary
RIGHTS

No Rights history available

stock-summaryKey Factors

Quality key factors stock-summary

Factor
Value
Sales Growth (5y)
10.06%
EBIT Growth (5y)
17.31%
EBIT to Interest (avg)
13.65
Debt to EBITDA (avg)
0.76
Net Debt to Equity (avg)
-0.25
Sales to Capital Employed (avg)
2.04
Tax Ratio
20.40%
Dividend Payout Ratio
13.39%
Pledged Shares
0
Institutional Holding
16.64%
ROCE (avg)
25.52%
ROE (avg)
16.31%

Valuation key factors

Factor
Value
P/E Ratio
34
Industry P/E
32
Price to Book Value
5.67
EV to EBIT
30.15
EV to EBITDA
24.39
EV to Capital Employed
7.19
EV to Sales
2.87
PEG Ratio
NA
Dividend Yield
0.40%
ROCE (Latest)
23.87%
ROE (Latest)
16.47%

Technicals key factors

Indicator
Weekly
Monthly
MACD
Mildly Bearish
Mildly Bearish
RSI
No Signal
No Signal
Bollinger Bands
Bearish
Bearish
Moving Averages
Mildly Bullish (Daily)
KST
Mildly Bearish
Mildly Bearish
Dow Theory
Mildly Bearish
Mildly Bullish
OBV
Mildly Bearish
No Trend
stock-summary Technical Indicator Scale: Bearish, Mildly Bearish, Sideways, Mildly Bullish, Bullish  Turned 
stock-summaryShareholding
Shareholding Snapshot : Jun 2026stock-summary
Shareholding Compare (%holding) stock-summary
Majority shareholders

Promoters

Pledged Promoter Holdings

None

Mutual Funds

Held by 10 Schemes (8.22%)

FIIs

Held by 126 FIIs (6.41%)

Promoter with highest holding

Kirloskar Industries Ltd (23.91%)

Highest Public shareholder

Nippon Life India Trustee Ltd-a/c Nippon India Small Cap Fund (5.7%)

Individual Investors Holdings

12.28%

stock-summaryFinancial
[
  {
    "link": "quarterly",
    "btn_text": "All Quarterly Results",
    "header": "Quarterly Results Snapshot (Consolidated) - Jun'26 - YoY",
    "rhs": [
      {
        "prefix": "Net Sales ",
        "suffix": "YoY Growth in quarter ended Jun 2026 is 12.86% vs -5.03% in Jun 2025",
        "dir": 1
      },
      {
        "prefix": "Consolidated Net Profit ",
        "suffix": "YoY Growth in quarter ended Jun 2026 is -0.15% vs 2.46% in Jun 2025",
        "dir": -1
      }
    ],
    "table": {
      "header": [
        "Jun'26",
        "Jun'25",
        "Change(%)"
      ],
      "body": [
        {
          "field": "Net Sales",
          "val1": "1,104.90",
          "val2": "979.00",
          "chgp": "12.86%",
          "chgp_class": "positive"
        },
        {
          "field": "Operating Profit (PBDIT) excl Other Income",
          "val1": "115.80",
          "val2": "111.70",
          "chgp": "3.67%",
          "chgp_class": "positive"
        },
        {
          "field": "Interest",
          "val1": "8.10",
          "val2": "6.20",
          "chgp": "30.65%",
          "chgp_class": "negative"
        },
        {
          "field": "Exceptional Items",
          "val1": "0.00",
          "val2": "-0.30",
          "chgp": "100.00%",
          "chgp_class": "positive"
        },
        {
          "field": "Consolidate Net Profit",
          "val1": "66.60",
          "val2": "66.70",
          "chgp": "-0.15%",
          "chgp_class": "negative"
        },
        {
          "field": "Operating Profit Margin (Excl OI)",
          "val1": "10.48%",
          "val2": "11.41%",
          "chgp": "-0.93%",
          "chgp_class": "negative"
        }
      ]
    }
  },
  {
    "link": "half-yearly",
    "btn_text": "All Half Yearly Results",
    "header": "Half Yearly Results Snapshot (Consolidated) - Sep'25",
    "rhs": [
      {
        "prefix": "Net Sales ",
        "suffix": " Growth in half year ended Sep 2025 is -2.90% vs 14.02% in Sep 2024",
        "dir": -1
      },
      {
        "prefix": "Consolidated Net Profit ",
        "suffix": " Growth in half year ended Sep 2025 is -14.37% vs 40.93% in Sep 2024",
        "dir": -1
      }
    ],
    "table": {
      "header": [
        "Sep'25",
        "Sep'24",
        "Change(%)"
      ],
      "body": [
        {
          "field": "Net Sales",
          "val1": "2,006.70",
          "val2": "2,066.70",
          "chgp": "-2.90%",
          "chgp_class": "negative"
        },
        {
          "field": "Operating Profit (PBDIT) excl Other Income",
          "val1": "220.10",
          "val2": "253.80",
          "chgp": "-13.28%",
          "chgp_class": "negative"
        },
        {
          "field": "Interest",
          "val1": "12.70",
          "val2": "11.40",
          "chgp": "11.40%",
          "chgp_class": "negative"
        },
        {
          "field": "Exceptional Items",
          "val1": "2.50",
          "val2": "0.10",
          "chgp": "2,400.00%",
          "chgp_class": "positive"
        },
        {
          "field": "Consolidate Net Profit",
          "val1": "137.70",
          "val2": "160.80",
          "chgp": "-14.37%",
          "chgp_class": "negative"
        },
        {
          "field": "Operating Profit Margin (Excl OI)",
          "val1": "10.97%",
          "val2": "12.28%",
          "chgp": "-1.31%",
          "chgp_class": "negative"
        }
      ]
    }
  },
  {
    "link": "nine-monthly",
    "btn_text": "All Nine Monthly Results",
    "header": "Nine Monthly Results Snapshot (Consolidated) - Dec'25",
    "rhs": [
      {
        "prefix": "Net Sales ",
        "suffix": "YoY Growth in nine months ended Dec 2025 is -2.74% vs 15.61% in Dec 2024",
        "dir": -1
      },
      {
        "prefix": "Consolidated Net Profit ",
        "suffix": "YoY Growth in nine months ended Dec 2025 is -5.76% vs 41.84% in Dec 2024",
        "dir": -1
      }
    ],
    "table": {
      "header": [
        "Dec'25",
        "Dec'24",
        "Change(%)"
      ],
      "body": [
        {
          "field": "Net Sales",
          "val1": "3,122.90",
          "val2": "3,210.90",
          "chgp": "-2.74%",
          "chgp_class": "negative"
        },
        {
          "field": "Operating Profit (PBDIT) excl Other Income",
          "val1": "361.90",
          "val2": "419.70",
          "chgp": "-13.77%",
          "chgp_class": "negative"
        },
        {
          "field": "Interest",
          "val1": "21.30",
          "val2": "19.00",
          "chgp": "12.11%",
          "chgp_class": "negative"
        },
        {
          "field": "Exceptional Items",
          "val1": "-13.10",
          "val2": "-6.10",
          "chgp": "-114.75%",
          "chgp_class": "negative"
        },
        {
          "field": "Consolidate Net Profit",
          "val1": "262.00",
          "val2": "278.00",
          "chgp": "-5.76%",
          "chgp_class": "negative"
        },
        {
          "field": "Operating Profit Margin (Excl OI)",
          "val1": "11.59%",
          "val2": "13.07%",
          "chgp": "-1.48%",
          "chgp_class": "negative"
        }
      ]
    }
  },
  {
    "link": "annual",
    "btn_text": "All Annual Results",
    "header": "Annual Results Snapshot (Consolidated) - Mar'26",
    "rhs": [
      {
        "prefix": "Net Sales ",
        "suffix": "YoY Growth in year ended Mar 2026 is 1.02% vs 12.27% in Mar 2025",
        "dir": -1
      },
      {
        "prefix": "Consolidated Net Profit ",
        "suffix": "YoY Growth in year ended Mar 2026 is -10.04% vs 19.24% in Mar 2025",
        "dir": -1
      }
    ],
    "table": {
      "header": [
        "Mar'26",
        "Mar'25",
        "Change(%)"
      ],
      "body": [
        {
          "field": "Net Sales",
          "val1": "4,538.00",
          "val2": "4,492.20",
          "chgp": "1.02%",
          "chgp_class": "positive"
        },
        {
          "field": "Operating Profit (PBDIT) excl Other Income",
          "val1": "544.10",
          "val2": "609.20",
          "chgp": "-10.69%",
          "chgp_class": "negative"
        },
        {
          "field": "Interest",
          "val1": "30.10",
          "val2": "24.80",
          "chgp": "21.37%",
          "chgp_class": "negative"
        },
        {
          "field": "Exceptional Items",
          "val1": "-38.90",
          "val2": "-7.80",
          "chgp": "-398.72%",
          "chgp_class": "negative"
        },
        {
          "field": "Consolidate Net Profit",
          "val1": "373.50",
          "val2": "415.20",
          "chgp": "-10.04%",
          "chgp_class": "negative"
        },
        {
          "field": "Operating Profit Margin (Excl OI)",
          "val1": "11.99%",
          "val2": "13.56%",
          "chgp": "-1.57%",
          "chgp_class": "negative"
        }
      ]
    }
  }
]

Quarterly Results Snapshot (Consolidated) - Jun'26 - YoYstock-summary

Jun'26
Jun'25
Change(%)
Net Sales
1,104.90
979.00
12.86%
Operating Profit (PBDIT) excl Other Income
115.80
111.70
3.67%
Interest
8.10
6.20
30.65%
Exceptional Items
0.00
-0.30
100.00%
Consolidate Net Profit
66.60
66.70
-0.15%
Operating Profit Margin (Excl OI)
10.48%
11.41%
-0.93%
Values in Rs Cr.
Direction Arrows
Net Sales

YoY Growth in quarter ended Jun 2026 is 12.86% vs -5.03% in Jun 2025

Direction Arrows
Consolidated Net Profit

YoY Growth in quarter ended Jun 2026 is -0.15% vs 2.46% in Jun 2025

Half Yearly Results Snapshot (Consolidated) - Sep'25stock-summary

Sep'25
Sep'24
Change(%)
Net Sales
2,006.70
2,066.70
-2.90%
Operating Profit (PBDIT) excl Other Income
220.10
253.80
-13.28%
Interest
12.70
11.40
11.40%
Exceptional Items
2.50
0.10
2,400.00%
Consolidate Net Profit
137.70
160.80
-14.37%
Operating Profit Margin (Excl OI)
10.97%
12.28%
-1.31%
Values in Rs Cr.
Direction Arrows
Net Sales

Growth in half year ended Sep 2025 is -2.90% vs 14.02% in Sep 2024

Direction Arrows
Consolidated Net Profit

Growth in half year ended Sep 2025 is -14.37% vs 40.93% in Sep 2024

Nine Monthly Results Snapshot (Consolidated) - Dec'25stock-summary

Dec'25
Dec'24
Change(%)
Net Sales
3,122.90
3,210.90
-2.74%
Operating Profit (PBDIT) excl Other Income
361.90
419.70
-13.77%
Interest
21.30
19.00
12.11%
Exceptional Items
-13.10
-6.10
-114.75%
Consolidate Net Profit
262.00
278.00
-5.76%
Operating Profit Margin (Excl OI)
11.59%
13.07%
-1.48%
Values in Rs Cr.
Direction Arrows
Net Sales

YoY Growth in nine months ended Dec 2025 is -2.74% vs 15.61% in Dec 2024

Direction Arrows
Consolidated Net Profit

YoY Growth in nine months ended Dec 2025 is -5.76% vs 41.84% in Dec 2024

Annual Results Snapshot (Consolidated) - Mar'26stock-summary

Mar'26
Mar'25
Change(%)
Net Sales
4,538.00
4,492.20
1.02%
Operating Profit (PBDIT) excl Other Income
544.10
609.20
-10.69%
Interest
30.10
24.80
21.37%
Exceptional Items
-38.90
-7.80
-398.72%
Consolidate Net Profit
373.50
415.20
-10.04%
Operating Profit Margin (Excl OI)
11.99%
13.56%
-1.57%
Values in Rs Cr.
Direction Arrows
Net Sales

YoY Growth in year ended Mar 2026 is 1.02% vs 12.27% in Mar 2025

Direction Arrows
Consolidated Net Profit

YoY Growth in year ended Mar 2026 is -10.04% vs 19.24% in Mar 2025

stock-summaryCompany CV
About Kirloskar Brothers Ltd stock-summary
stock-summary
Kirloskar Brothers Ltd
Small Cap
Compressors, Pumps & Diesel Engines
Kirloskar Brothers Limited (KBL), a part of the century old Kirloskar Group was incorporated on 15 January, 1920. The Company is one of India's pioneering industrial organisations in the engineering sector. The Company undertakes projects in fluid-handling, turnkey fluid-handling projects in irrigation, power, process, water supply and sewerage, turnkey small hydel projects and protective surface coating.
Company Coordinates stock-summary
Company Details
Yamuna Survey No 98 (3-7), Baner Pune Maharashtra : 411045
stock-summary
Tel: 020 6721 4444
stock-summary
secretarial@kbl.co.in
Registrar Details
Link Intime India Pvt Ltd, C-13 Pannalal Silk Compound, L B S Marg, Bhandup , Mumbai