
Compare Kirl. Electric with Similar Stocks
Stock DNA
Other Electrical Equipment
INR 681 Cr (Micro Cap)
32.00
47
0.00%
0.52
16.36%
5.17
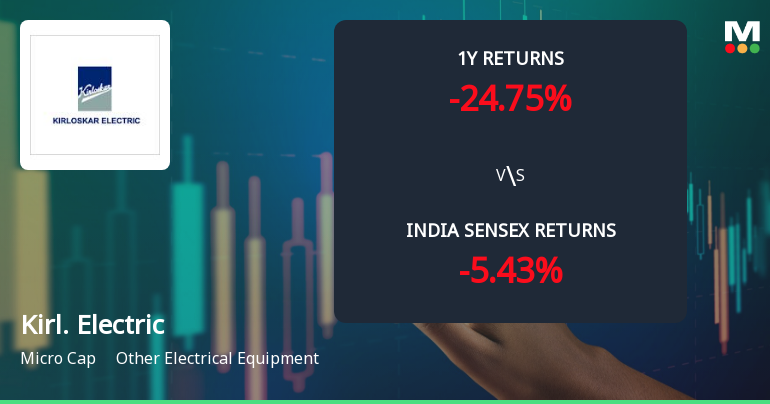
Total Returns (Price + Dividend) 
Kirl. Electric for the last several years.
Risk Adjusted Returns v/s
Returns Beta

News
Kirloskar Electric Company Ltd Faces Technical Momentum Shift Amid Mixed Market Signals
Kirloskar Electric Company Ltd (stock code 313343) has experienced a notable shift in its technical momentum, with key indicators signalling a transition from a mildly bullish stance to a sideways or bearish outlook. The company’s micro-cap status and recent downgrade from Hold to Sell by MarketsMOJO reflect growing concerns amid weakening price momentum and mixed technical signals.
Read full news article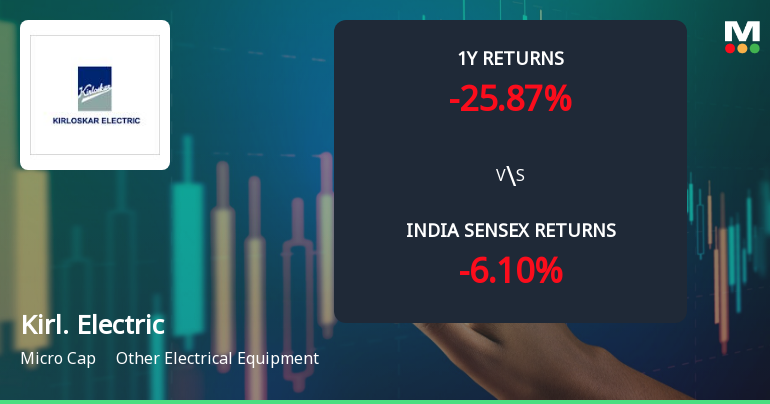
Kirloskar Electric Company Ltd Technical Momentum Shifts Amid Mixed Indicator Signals
Kirloskar Electric Company Ltd, a micro-cap player in the Other Electrical Equipment sector, has experienced a subtle shift in price momentum, moving from a sideways trend to a mildly bullish stance. Despite this positive tilt, technical indicators present a mixed picture, with some signals suggesting caution for investors amid ongoing volatility.
Read full news article
Kirloskar Electric Company Ltd is Rated Sell
Kirloskar Electric Company Ltd is rated Sell by MarketsMOJO, with this rating last updated on 27 May 2026. However, the analysis and financial metrics presented here reflect the stock’s current position as of 13 June 2026, providing investors with the latest insights into the company’s fundamentals, valuation, financial trend, and technical outlook.
Read full news article Announcements
Announcement under Regulation 30 (LODR)-Press Release / Media Release
28-May-2026 | Source : BSEKirloskar Electric Company Limited has informed exchange regarding a press release dated May 28 2026 titled Kirloskar Electric Company Limited reports FY26 results; underlying business performance remains strong.
Announcement under Regulation 30 (LODR)-Newspaper Publication
28-May-2026 | Source : BSENewspaper publication of Audited financial results.
Board Meeting Outcome for Outcome Of The Board Meeting And Audited Financial Results For The Quarter And Financial Year Ended March 31 2026.
26-May-2026 | Source : BSEOutcome of the Board meeting and audited financial results for the quarter and financial year ended March 31 2026.
Corporate Actions

No Upcoming Board Meetings

No Dividend history available

No Splits history available

No Bonus history available

No Rights history available
Quality key factors
Valuation key factors
Technicals key factors
 Technical Indicator Scale: Bearish, Mildly Bearish, Sideways, Mildly Bullish, Bullish Turned
 Shareholding Snapshot : Mar 2026
Shareholding Compare (%holding)
Promoters
75.3331
Held by 0 Schemes
Held by 7 FIIs (1.17%)
Vijay Ravindra Kirloskar (18.13%)
Ajay Upadhyaya (4.52%)
39.31%
Quarterly Results Snapshot (Consolidated) - Mar'26 - QoQ

QoQ Growth in quarter ended Mar 2026 is 8.02% vs 6.55% in Dec 2025

QoQ Growth in quarter ended Mar 2026 is -115.37% vs -58.92% in Dec 2025
Half Yearly Results Snapshot (Consolidated) - Sep'25
Growth in half year ended Sep 2025 is -6.98% vs 12.25% in Sep 2024
Growth in half year ended Sep 2025 is 48.15% vs -1.82% in Sep 2024
Nine Monthly Results Snapshot (Consolidated) - Dec'25
YoY Growth in nine months ended Dec 2025 is 2.67% vs 6.65% in Dec 2024
YoY Growth in nine months ended Dec 2025 is 91.04% vs -12.36% in Dec 2024
Annual Results Snapshot (Consolidated) - Mar'26
YoY Growth in year ended Mar 2026 is 8.37% vs -2.43% in Mar 2025
YoY Growth in year ended Mar 2026 is 124.06% vs -73.44% in Mar 2025
About Kirloskar Electric Company Ltd

Company Coordinates


