
Compare Kirl. Ferrous with Similar Stocks
Dashboard
Strong ability to service debt as the company has a low Debt to EBITDA ratio of 1.23 times
Poor long term growth as Operating profit has grown by an annual rate -4.65% of over the last 5 years
Positive results in Mar 26
With ROCE of 12.4, it has a Very Attractive valuation with a 1.9 Enterprise value to Capital Employed
Increasing Participation by Institutional Investors
Underperformed the market in the last 1 year
Stock DNA
Ferrous Metals
INR 7,957 Cr (Small Cap)
21.00
26
1.16%
0.25
9.91%
2.11
Total Returns (Price + Dividend) 
Latest dividend: 3 per share ex-dividend date: Feb-16-2026
Risk Adjusted Returns v/s
Returns Beta

News
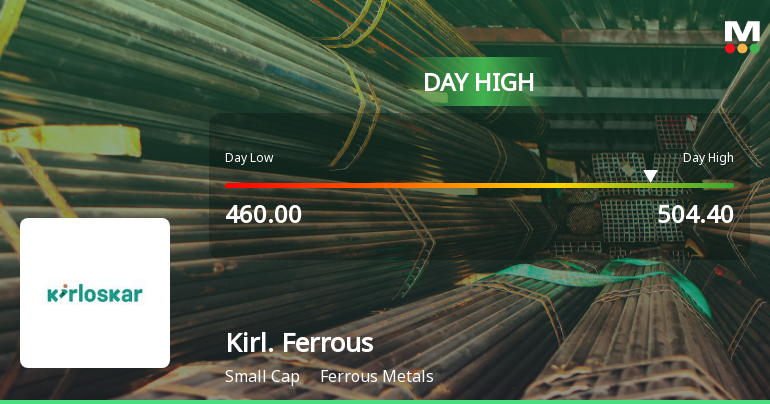
Kirloskar Ferrous Industries Ltd Surges 13.1% to Day's High of Rs 502.45 — Outperforms Sector by 12.37 Percentage Points
The Sensex edged down by 0.05% on 18 Jun 2026, while Kirloskar Ferrous Industries Ltd surged 13.1%, marking a remarkable 12.37 percentage-point outperformance over its Ferrous Metals sector peers. This sharp single-session gain rewrites the short-term narrative for the stock, which has been on a two-day winning streak.
Read full news article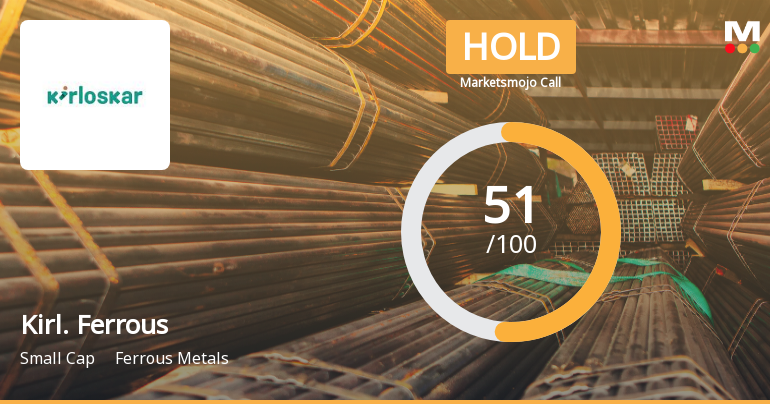
Kirloskar Ferrous Industries Ltd Upgraded to Hold on Technical Improvements and Valuation Appeal
Kirloskar Ferrous Industries Ltd has seen its investment rating upgraded from Sell to Hold, reflecting a nuanced improvement across technical indicators, valuation metrics, financial trends, and overall quality. This shift comes amid a backdrop of mixed market performance and positive quarterly financial results, signalling cautious optimism for investors in the ferrous metals sector.
Read full news article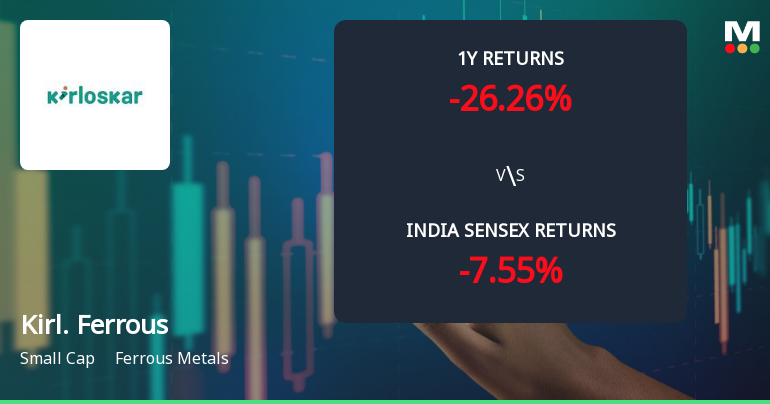
Kirloskar Ferrous Industries Ltd Sees Mixed Technical Signals Amid Mild Momentum Shift
Kirloskar Ferrous Industries Ltd, a small-cap player in the ferrous metals sector, has experienced a nuanced shift in its technical momentum, reflected in a blend of bullish and bearish signals across key indicators. Despite a 2.8% rise in the latest trading session, the stock’s overall technical profile remains cautiously bearish, prompting a recent downgrade in its Mojo Grade from Hold to Sell.
Read full news article Announcements
Announcement under Regulation 30 (LODR)-Analyst / Investor Meet - Outcome
18-Jun-2026 | Source : BSEUpdate in respect of the meeting with investor / analyst / financial institution
Announcement under Regulation 30 (LODR)-Award_of_Order_Receipt_of_Order
17-Jun-2026 | Source : BSEContract for supply of pig iron
Announcement under Regulation 30 (LODR)-Newspaper Publication
16-Jun-2026 | Source : BSENotice to the Members published in the newspapers
Corporate Actions

No Upcoming Board Meetings

Kirloskar Ferrous Industries Ltd has declared 60% dividend, ex-date: 16 Feb 26

No Splits history available

No Bonus history available

Kirloskar Ferrous Industries Ltd has announced 9:10 rights issue, ex-date: 19 Dec 06
Quality key factors
Valuation key factors
Technicals key factors
 Technical Indicator Scale: Bearish, Mildly Bearish, Sideways, Mildly Bullish, Bullish Turned
 Shareholding Snapshot : Mar 2026
Shareholding Compare (%holding)
Promoters
None
Held by 14 Schemes (11.99%)
Held by 86 FIIs (1.78%)
Kirloskar Industries Limited (45.93%)
Hdfc Small Cap Fund (4.79%)
20.11%
Quarterly Results Snapshot (Consolidated) - Mar'26 - QoQ

QoQ Growth in quarter ended Mar 2026 is 12.31% vs -7.82% in Dec 2025
QoQ Growth in quarter ended Mar 2026 is 130.87% vs -38.20% in Dec 2025
Half Yearly Results Snapshot (Consolidated) - Sep'25
Growth in half year ended Sep 2025 is 7.26% vs 5.14% in Sep 2024
Growth in half year ended Sep 2025 is 23.08% vs -15.59% in Sep 2024
Nine Monthly Results Snapshot (Consolidated) - Dec'25
YoY Growth in nine months ended Dec 2025 is 5.06% vs 4.70% in Dec 2024
YoY Growth in nine months ended Dec 2025 is 16.38% vs -27.95% in Dec 2024
Annual Results Snapshot (Consolidated) - Mar'26

YoY Growth in year ended Mar 2026 is 4.94% vs 6.80% in Mar 2025
YoY Growth in year ended Mar 2026 is 21.69% vs -1.26% in Mar 2025
About Kirloskar Ferrous Industries Ltd

Company Coordinates


