Sarda Energy

  • Market Cap: Small Cap
  • Industry: Ferrous Metals
  • ISIN: INE385C01021
  • NSEID: SARDAEN
  • BSEID: 504614
INR
548.80
-19.55 (-3.44%)
BSENSE

May 25

BSE+NSE Vol: 10.99 lacs

  • Price Points
  • Score
  • Mojo Parameters
  • Total Return
  • News and Corporate Actions
  • Key factors
  • Shareholding
  • Financials
  • CompanyCV
stock-summaryPrice Point
High/Low

1Day

52 Week

Valuation
Technical
Day's Volume

CASH

10.99 lacs (207.07%) Volume

Shareholding (Mar 2026)

FII

3.51%

Held by 101 FIIs

DII

3.32%

Held by 5 DIIs

Promoter

73.16%

how big is Sarda Energy?

06-Jun-2025

As of Jun 06, Sarda Energy & Minerals Ltd has a market capitalization of 15,393.78 Cr, with recent net sales of 4,642.85 Cr and net profit of 699.81 Cr on a consolidated basis. Shareholder's funds are 3,888.64 Cr, and total assets amount to 6,001.85 Cr.

Market Cap: As of Jun 06, Sarda Energy & Minerals Ltd has a market capitalization of 15,393.78 Cr, categorizing it as a Mid Cap company.<BR><BR>Recent Quarterly Performance: For the latest four quarters, Sarda Energy reported a sum of Net Sales of 4642.85 Cr and a sum of Net Profit of 699.81 Cr. This data is on a Consolidated basis.<BR><BR>Balance Sheet Snapshot: The balance sheet data is also on a Consolidated basis for the latest annual period ending in Mar'24. Shareholder's Funds are reported at 3,888.64 Cr, while Total Assets amount to 6,001.85 Cr.

View full answer

Has Sarda Energy declared dividend?

06-Jun-2025

Sarda Energy & Minerals Ltd has declared a 100% dividend, amounting to ₹1 per share, with an ex-date of August 30, 2024. The company has demonstrated strong total returns over various periods, particularly a total return of 2467.69% over the past 5 years.

Sarda Energy & Minerals Ltd has declared a 100% dividend.<BR><BR>Dividend Details:<BR>- Percentage announced: 100%<BR>- Amount per share: 1 per share<BR>- Ex-date: 30 Aug 2024<BR><BR>Dividend Yield: 0.23%.<BR><BR>Total Returns by Period:<BR>In the last 6 months, the price return was -7.13%, with a dividend return of 0%, resulting in a total return of -7.13%.<BR><BR>Over the past year, the price return was 101.08%, the dividend return was 0.44%, leading to a total return of 101.52%.<BR><BR>In the 2-year period, the price return reached 260.8%, with a dividend return of 1.24%, culminating in a total return of 262.04%.<BR><BR>For the 3-year period, the price return was 397.5%, the dividend return was 2.23%, resulting in a total return of 399.73%.<BR><BR>In the last 4 years, the price return was 723.07%, with a dividend return of 25.70%, leading to a total return of 748.77%.<BR><BR>Over the past 5 years, the price return was 2336.51%, the dividend return was 131.18%, resulting in a total return of 2467.69%.<BR><BR>Overall, Sarda Energy has declared a significant dividend while showing strong total returns over multiple periods, particularly in the long term, indicating a positive performance trend for investors.

View full answer

Who are the peers of the Sarda Energy?

03-Jun-2025

Sarda Energy's peers include JSW Steel, Tata Steel, Jindal Steel, and Lloyds Metals, among others. In terms of performance, Lloyds Metals leads with a 1-year return of 105.66%, while Sarda Energy has a return of 91.64%, significantly higher than NMDC Steel's -38.39%.

Peers: The peers of Sarda Energy are JSW Steel, Tata Steel, Jindal Steel, Lloyds Metals, SAIL, NMDC Steel, Jai Balaji Inds., Kirl. Ferrous, Sunflag Iron, and Indian Metals.<BR><BR>Quality Snapshot: Excellent management risk is observed at JSW Steel, Jindal Steel, Lloyds Metals, and Kirl. Ferrous, while Average management risk is found at Sarda Energy, Jai Balaji Inds., and Sunflag Iron. Good growth is seen at Lloyds Metals, Sarda Energy, and Indian Metals, while Average growth is noted at Tata Steel and Jindal Steel, and Below Average growth is present at SAIL, NMDC Steel, and Jai Balaji Inds. For capital structure, Excellent ratings are given to Lloyds Metals and Indian Metals, Good ratings to Jindal Steel, Sarda Energy, Kirl. Ferrous, and Sunflag Iron, and Below Average ratings to JSW Steel, SAIL, NMDC Steel, and Jai Balaji Inds.<BR><BR>Return Snapshot: The peer with the highest 1-year return is Lloyds Metals at 105.66%, while NMDC Steel has the lowest at -38.39%. Sarda Energy's own 1-year return of 91.64% is significantly higher than NMDC Steel's. Additionally, NMDC Steel, Jai Balaji Inds., and Kirl. Ferrous all have negative six-month returns.

View full answer

Who are in the management team of Sarda Energy?

16-Jul-2025

As of March 2023, the management team of Sarda Energy includes K K Sarda (Chairman & Managing Director), Pankaj Sarda (Joint Managing Director), and several independent directors, along with key roles such as Company Secretary and CFO, overseeing the company's strategic direction and governance.

As of March 2023, the management team of Sarda Energy includes the following individuals:<BR><BR>1. K K Sarda - Chairman & Managing Director<BR>2. Pankaj Sarda - Joint Managing Director<BR>3. Rakesh Mehra - Non-Executive & Independent Director<BR>4. A K Basu - Non-Executive & Independent Director<BR>5. Jitender Balakrishnan - Non-Executive & Independent Director<BR>6. Manish Sethi - Company Secretary & Compliance Officer<BR>7. P K Jain - Whole Time Director & CFO<BR>8. Tripti Sinha - Non-Executive & Independent Director<BR>9. Amal Kumar Debnath - Independent Director<BR>10. Binoy Parikh - Independent Director<BR><BR>This team is responsible for the strategic direction and governance of the company.

View full answer

What does Sarda Energy do?

17-Jul-2025

Sarda Energy & Minerals Ltd is a Mid Cap company involved in integrated steel manufacturing, ferro alloys production, and operates in the metal, mining, and power sectors. As of March 2025, it reported net sales of ₹12,388 Cr and a net profit of ₹1,083 Cr.

Overview:<BR>Sarda Energy & Minerals Ltd is engaged in integrated steel manufacturing, ferro alloys production, and operates in the metal, mining, and power sectors within the Ferrous Metals industry, categorized as a Mid Cap company.<BR><BR>History:<BR>The company was established on June 23, 1976, originally named Raipur Alloys & Steel Ltd. It underwent a name change in 1985 after being purchased by the Sarda Group in 1979. The latest quarterly results reported net sales and net profit for March 2025.<BR><BR>Financial Snapshot:<BR>Net Sales: 12,388 Cr (Quarterly Results - Mar 2025) <BR>Net Profit: 1,083 Cr (Quarterly Results - Mar 2025) <BR>Market Cap: INR 15,663 Cr (Mid Cap)<BR><BR>Key Metrics:<BR>P/E: 22.00 <BR>Industry P/E: 34 <BR>Dividend Yield: 0.23% <BR>Debt Equity: 0.26 <BR>Return on Equity: 11.14% <BR>Price to Book: 2.49 <BR><BR>Contact Details:<BR>Address: 73/A, Central Avenue Nagpur Maharashtra : 440018 <BR>Tel: 91-0712-2722407 <BR>Email: info@seml.co.in <BR>Website: http://www.seml.co.in

View full answer

Who are the top shareholders of the Sarda Energy?

17-Jul-2025

The top shareholders of Sarda Energy include Chhattisgarh Investments Ltd. with 39.04%, 14 mutual fund schemes holding 0.52%, and 101 foreign institutional investors with 3.47%. Additionally, Abakkus Emerging Opportunities Fund -1 is the largest public shareholder at 1.46%, while individual investors collectively own 15.5%.

The top shareholders of Sarda Energy include several key players. The majority shareholder is Chhattisgarh Investments Ltd., which holds a significant 39.04% of the company. In addition, there are 14 mutual fund schemes collectively holding 0.52%, and 101 foreign institutional investors (FIIs) with a combined holding of 3.47%. The highest public shareholder is Abakkus Emerging Opportunities Fund -1, which owns 1.46%. Individual investors also have a notable presence, holding 15.5% of the shares. Overall, the promoter group holds a dominant position in the company's shareholding structure.

View full answer

How has been the historical performance of Sarda Energy?

12-Nov-2025

Sarda Energy has shown significant growth in net sales and profitability, with net sales rising from 3,868.13 crore in March 2024 to 4,642.85 crore in March 2025, and profit after tax increasing from 508.63 crore to 681.19 crore during the same period. Despite higher expenditures and investment outflows, the company's financial metrics indicate robust performance.

Answer:<BR>The historical performance of Sarda Energy shows significant growth in net sales and profitability over the years, particularly from March 2024 to March 2025.<BR><BR>Breakdown:<BR>Sarda Energy's net sales increased from 3,868.13 crore in March 2024 to 4,642.85 crore in March 2025, reflecting a strong upward trend. Total operating income also rose to 4,642.85 crore in March 2025 from 3,868.13 crore in the previous year. The company's total expenditure, excluding depreciation, was 3,405.50 crore in March 2025, up from 3,070.31 crore in March 2024. Operating profit (PBDIT) showed a notable increase to 1,409.75 crore in March 2025, compared to 981.99 crore in March 2024. Profit before tax also rose to 917.76 crore in March 2025 from 667.37 crore in March 2024, leading to a profit after tax of 681.19 crore, up from 508.63 crore. The consolidated net profit for March 2025 was 699.82 crore, an increase from 523.00 crore in March 2024. The company's total assets grew to 10,124.58 crore in March 2025, compared to 6,001.85 crore in March 2024, while total liabilities also increased to 10,124.58 crore from 6,001.85 crore. Cash flow from operating activities improved to 885.00 crore in March 2025, up from 742.00 crore in March 2024, although cash flow from investing activities showed a significant outflow of -2,131.00 crore. Overall, Sarda Energy's financial metrics indicate a robust performance with increasing revenues and profits, despite higher expenditures and investment outflows.

View full answer

Is Sarda Energy technically bullish or bearish?

04-Dec-2025

As of December 3, 2025, Sarda Energy's technical trend has shifted to a bearish stance, with key indicators like the MACD and Bollinger Bands signaling bearish conditions despite mildly bullish daily moving averages.

As of 3 December 2025, the technical trend for Sarda Energy has changed from mildly bullish to sideways. The current technical stance is bearish, with key indicators driving this conclusion being the weekly and monthly MACD both showing mildly bearish signals, along with the weekly Bollinger Bands indicating bearish conditions. The moving averages on the daily timeframe are mildly bullish, but this is overshadowed by the overall bearish sentiment reflected in the KST and OBV on the weekly timeframe. The lack of clear trends in the Dow Theory further supports a neutral to bearish outlook.

View full answer

Is Sarda Energy overvalued or undervalued?

04-Dec-2025

As of December 3, 2025, Sarda Energy is fairly valued with a PE ratio of 15.97, lower than its peers like JSW Steel and Tata Steel, and has strong profitability metrics, despite slightly underperforming the Sensex recently, while achieving a remarkable 361.55% return over the last three years.

As of 3 December 2025, Sarda Energy's valuation grade has moved from expensive to fair, indicating a more favorable assessment of its market position. The company is currently fairly valued, with a PE ratio of 15.97, an EV to EBITDA of 9.86, and a PEG ratio of 0.21, suggesting that it is trading at a reasonable price relative to its earnings growth potential. <BR><BR>In comparison to its peers, Sarda Energy's PE ratio is significantly lower than that of JSW Steel, which stands at 45.69, and Tata Steel, which has a PE of 27.99, reinforcing the notion that Sarda is more attractively priced within the industry. Additionally, Sarda's ROCE of 19.30% and ROE of 15.19% demonstrate strong profitability metrics, further supporting its fair valuation. While the stock has slightly underperformed the Sensex over the past month, its long-term performance remains robust, with a remarkable 361.55% return over the last three years.

View full answer

When is the next results date for Sarda Energy & Minerals Ltd?

12-May-2026

The next results date for Sarda Energy & Minerals Ltd is 23 May 2026.

The next results date for Sarda Energy & Minerals Ltd is scheduled for 23 May 2026.

View full answer

Are Sarda Energy & Minerals Ltd latest results good or bad?

24-May-2026

Sarda Energy & Minerals Ltd's latest results show strong year-on-year growth with a 45.90% increase in net profit, but sequentially, both net profit and revenue declined, raising concerns about demand and pricing pressures in the steel sector. Overall, while annual performance is positive, recent trends suggest potential challenges ahead.

Sarda Energy & Minerals Ltd's latest results present a mixed picture. On one hand, the company reported a significant year-on-year increase in net profit of 45.90%, reaching ₹157.99 crores for Q4 FY26, which is a positive sign. Additionally, net sales showed a modest year-on-year growth of 1.19%, totaling ₹1,253.57 crores.<BR><BR>However, when looking at the sequential performance, there are notable concerns. Both net profit and revenue declined compared to the previous quarter, with net profit down 17.01% and revenue down 1.76%. This trend indicates weakening demand and pricing pressures in the steel sector, which is a significant challenge for integrated steel producers like Sarda Energy.<BR><BR>Operating margins also experienced compression, decreasing to 28.02% from 24.65% in the previous quarter, reflecting the pressures from elevated input costs and lower realizations. The overall financial performance suggests that while the company has achieved strong year-on-year growth, the recent sequential declines raise concerns about its near-term outlook.<BR><BR>In summary, while the annual results are strong, the quarterly performance indicates potential headwinds ahead, making the current situation somewhat challenging for the company.

View full answer

Should I buy, sell or hold Sarda Energy & Minerals Ltd?

24-May-2026

Why is Sarda Energy & Minerals Ltd falling/rising?

25-May-2026

As of 24-May, Sarda Energy & Minerals Ltd's stock price is rising to 568.50, reflecting a positive momentum with a year-to-date return of 9.26%. This growth is supported by strong investor participation and solid financial health, outperforming the broader market significantly.

As of 24-May, Sarda Energy & Minerals Ltd's stock price is rising, currently at 568.50, reflecting a change of 6.85 (1.22%) upward. This increase can be attributed to several factors. The stock has shown a strong performance over the last four days, gaining 6.08% during this period, which indicates a positive momentum. Additionally, it has outperformed its sector by 0.83% today, suggesting that investor sentiment is favorable.<BR><BR>The stock's performance relative to benchmarks also highlights its strength; it has delivered a year-to-date return of 9.26%, significantly outperforming the Sensex, which has declined by 11.51% in the same timeframe. Over the past year, Sarda Energy & Minerals Ltd has achieved a remarkable 20.80% return, while the broader market has seen a decline of 6.84%. Furthermore, the stock has demonstrated exceptional growth over the past three years, with a staggering 408.11% increase compared to the Sensex's 21.71%.<BR><BR>Investor participation appears to be rising, as evidenced by an 18.81% increase in delivery volume on May 21 compared to the five-day average. This suggests that more investors are willing to hold the stock, contributing to its upward price movement. The company's strong financial health, indicated by a low Debt to EBITDA ratio of 1.52 times and robust growth in net sales and operating profit, further supports the positive outlook for the stock.<BR><BR>Overall, the combination of consistent returns, strong investor participation, and solid financial performance are key factors driving the rise in Sarda Energy & Minerals Ltd's stock price.

View full answer
iScoreScore
Click here to find our call on this stock
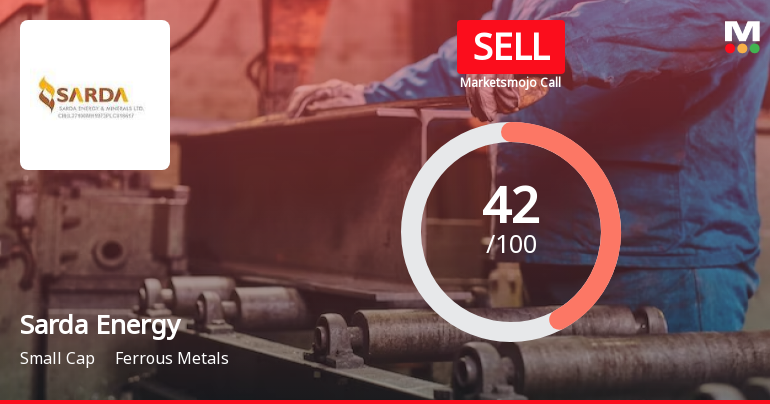
Strong Sell
Sell
Hold
Buy
Strong Buy

Dashboard

1

Strong ability to service debt as the company has a low Debt to EBITDA ratio of 1.52 times

 
2

Healthy long term growth as Net Sales has grown by an annual rate of 23.98% and Operating profit at 32.45%

 
3

Positive results in Mar 26

4

With ROE of 15.2, it has a Expensive valuation with a 2.9 Price to Book Value

5

Despite the size of the company, domestic mutual funds hold only 1.73% of the company

6

Consistent Returns over the last 3 years

stock-summaryMojo Parameters

Mojo Parameters

Loading Valuation Snapshot...

Stock DNA

stock-summary
Industry

Ferrous Metals

stock-summary
Market cap

INR 19,339 Cr (Small Cap)

stock-summary
P/E

19.00

stock-summary
Industry P/E

26

stock-summary
Dividend Yield

0.26%

stock-summary
Debt Equity

0.06

stock-summary
Return on Equity

15.19%

stock-summary
Price to Book

2.87

Revenue and Profits:
Net Sales:
1,254 Cr
(Quarterly Results - Mar 2026)
Net Profit:
158 Cr
stock-summaryTotal Returns
Total Returns (Price + Dividend) stock-summary
Dividend Yield (0.26%)
TimePeriod
Price Return
Dividend Return
Total Return
3 Months
3.12%
0%
3.12%
6 Months
12.23%
0%
12.23%
1 Year
16.92%
0.34%
17.26%
2 Years
107.8%
1.17%
108.97%
3 Years
366.19%
2.36%
368.55%
4 Years
534.89%
3.90%
538.79%
5 Years
914.14%
27.92%
942.06%

Latest dividend: 1.5 per share ex-dividend date: Aug-22-2025

Risk Adjusted Returns v/s stock-summary
Returns Beta
Icon
Beta has not been calculated since enough price history is not available
stock-summaryNews & Corporate Actions

News

Announcements stock-summary

Sarda Energy & Minerals Limited - Other General Purpose

09-Dec-2019 | Source : NSE

Sarda Energy & Minerals Limited has informed the Exchange regarding disclosure of Related Party Transactions for the half year ended 30.09.2019

Sarda Energy & Minerals Limited - Investor Presentation

13-Nov-2019 | Source : NSE

Sarda Energy & Minerals Limited has informed the Exchange regarding Investor Presentation

Sarda Energy & Minerals Limited - Shareholders meeting

22-Oct-2019 | Source : NSE

Sarda Energy & Minerals Limited has informed the Exchange with copy of minutes of Annual General Meeting held on September 21, 2019

Corporate Actions stock-summary

stock-summary
BOARD MEETING

No Upcoming Board Meetings

stock-summary
DIVIDEND

Sarda Energy & Minerals Ltd has declared 150% dividend, ex-date: 22 Aug 25

stock-summary
SPLITS

Sarda Energy & Minerals Ltd has announced 1:10 stock split, ex-date: 04 Aug 23

stock-summary
BONUS

No Bonus history available

stock-summary
RIGHTS

No Rights history available

stock-summaryKey Factors

Quality key factors stock-summary

Factor
Value
Sales Growth (5y)
23.98%
EBIT Growth (5y)
32.45%
EBIT to Interest (avg)
6.25
Debt to EBITDA (avg)
1.83
Net Debt to Equity (avg)
0.06
Sales to Capital Employed (avg)
0.71
Tax Ratio
27.35%
Dividend Payout Ratio
7.55%
Pledged Shares
0
Institutional Holding
6.83%
ROCE (avg)
19.49%
ROE (avg)
18.03%

Valuation key factors

Factor
Value
P/E Ratio
19
Industry P/E
26
Price to Book Value
2.87
EV to EBIT
14.96
EV to EBITDA
11.99
EV to Capital Employed
2.75
EV to Sales
3.61
PEG Ratio
0.36
Dividend Yield
0.26%
ROCE (Latest)
19.30%
ROE (Latest)
15.19%

Technicals key factors

Indicator
Weekly
Monthly
MACD
Bullish
Mildly Bearish
RSI
No Signal
No Signal
Bollinger Bands
Bullish
Mildly Bullish
Moving Averages
Bullish (Daily)
KST
Bullish
Mildly Bearish
Dow Theory
Mildly Bearish
No Trend
OBV
Mildly Bearish
No Trend
stock-summary Technical Indicator Scale: Bearish, Mildly Bearish, Sideways, Mildly Bullish, Bullish  Turned 
stock-summaryShareholding
Shareholding Snapshot : Mar 2026stock-summary
Shareholding Compare (%holding) stock-summary
Majority shareholders

Promoters

Pledged Promoter Holdings

None

Mutual Funds

Held by 17 Schemes (0.46%)

FIIs

Held by 101 FIIs (3.51%)

Promoter with highest holding

Chhattisgarh Investments Ltd. (39.04%)

Highest Public shareholder

Abakkus Emerging Opportunities Fund -1 (1.45%)

Individual Investors Holdings

15.65%

stock-summaryFinancial
[
  {
    "link": "quarterly",
    "btn_text": "All Quarterly Results",
    "header": "Quarterly Results Snapshot (Consolidated) - Mar'26 - YoY",
    "rhs": [
      {
        "prefix": "Net Sales ",
        "suffix": "YoY Growth in quarter ended Mar 2026 is 1.19% vs 39.31% in Mar 2025",
        "dir": -1
      },
      {
        "prefix": "Consolidated Net Profit ",
        "suffix": "YoY Growth in quarter ended Mar 2026 is 45.90% vs 14.74% in Mar 2025",
        "dir": 1
      }
    ],
    "table": {
      "header": [
        "Mar'26",
        "Mar'25",
        "Change(%)"
      ],
      "body": [
        {
          "field": "Net Sales",
          "val1": "1,253.57",
          "val2": "1,238.84",
          "chgp": "1.19%",
          "chgp_class": "positive"
        },
        {
          "field": "Operating Profit (PBDIT) excl Other Income",
          "val1": "347.56",
          "val2": "270.60",
          "chgp": "28.44%",
          "chgp_class": "positive"
        },
        {
          "field": "Interest",
          "val1": "53.53",
          "val2": "70.03",
          "chgp": "-23.56%",
          "chgp_class": "positive"
        },
        {
          "field": "Exceptional Items",
          "val1": "0.00",
          "val2": "-0.36",
          "chgp": "100.00%",
          "chgp_class": "positive"
        },
        {
          "field": "Consolidate Net Profit",
          "val1": "157.99",
          "val2": "108.29",
          "chgp": "45.90%",
          "chgp_class": "positive"
        },
        {
          "field": "Operating Profit Margin (Excl OI)",
          "val1": "28.02%",
          "val2": "22.00%",
          "chgp": "6.02%",
          "chgp_class": "positive"
        }
      ]
    }
  },
  {
    "link": "half-yearly",
    "btn_text": "All Half Yearly Results",
    "header": "Half Yearly Results Snapshot (Consolidated) - Sep'25",
    "rhs": [
      {
        "prefix": "Net Sales ",
        "suffix": " Growth in half year ended Sep 2025 is 51.61% vs 1.53% in Sep 2024",
        "dir": 1
      },
      {
        "prefix": "Consolidated Net Profit ",
        "suffix": " Growth in half year ended Sep 2025 is 92.19% vs 26.55% in Sep 2024",
        "dir": 1
      }
    ],
    "table": {
      "header": [
        "Sep'25",
        "Sep'24",
        "Change(%)"
      ],
      "body": [
        {
          "field": "Net Sales",
          "val1": "3,160.89",
          "val2": "2,084.87",
          "chgp": "51.61%",
          "chgp_class": "positive"
        },
        {
          "field": "Operating Profit (PBDIT) excl Other Income",
          "val1": "1,129.03",
          "val2": "597.85",
          "chgp": "88.85%",
          "chgp_class": "positive"
        },
        {
          "field": "Interest",
          "val1": "126.59",
          "val2": "90.50",
          "chgp": "39.88%",
          "chgp_class": "negative"
        },
        {
          "field": "Exceptional Items",
          "val1": "0.00",
          "val2": "0.00",
          "chgp": "",
          "chgp_class": "neutral"
        },
        {
          "field": "Consolidate Net Profit",
          "val1": "757.54",
          "val2": "394.16",
          "chgp": "92.19%",
          "chgp_class": "positive"
        },
        {
          "field": "Operating Profit Margin (Excl OI)",
          "val1": "35.93%",
          "val2": "28.95%",
          "chgp": "6.98%",
          "chgp_class": "positive"
        }
      ]
    }
  },
  {
    "link": "nine-monthly",
    "btn_text": "All Nine Monthly Results",
    "header": "Nine Monthly Results Snapshot (Consolidated) - Dec'25",
    "rhs": [
      {
        "prefix": "Net Sales ",
        "suffix": "YoY Growth in nine months ended Dec 2025 is 30.34% vs 14.27% in Dec 2024",
        "dir": 1
      },
      {
        "prefix": "Consolidated Net Profit ",
        "suffix": "YoY Growth in nine months ended Dec 2025 is 60.25% vs 38.00% in Dec 2024",
        "dir": 1
      }
    ],
    "table": {
      "header": [
        "Dec'25",
        "Dec'24",
        "Change(%)"
      ],
      "body": [
        {
          "field": "Net Sales",
          "val1": "4,436.88",
          "val2": "3,404.01",
          "chgp": "30.34%",
          "chgp_class": "positive"
        },
        {
          "field": "Operating Profit (PBDIT) excl Other Income",
          "val1": "1,439.86",
          "val2": "966.74",
          "chgp": "48.94%",
          "chgp_class": "positive"
        },
        {
          "field": "Interest",
          "val1": "190.93",
          "val2": "154.70",
          "chgp": "23.42%",
          "chgp_class": "negative"
        },
        {
          "field": "Exceptional Items",
          "val1": "10.24",
          "val2": "0.00",
          "chgp": "",
          "chgp_class": "neutral"
        },
        {
          "field": "Consolidate Net Profit",
          "val1": "947.91",
          "val2": "591.52",
          "chgp": "60.25%",
          "chgp_class": "positive"
        },
        {
          "field": "Operating Profit Margin (Excl OI)",
          "val1": "32.45%",
          "val2": "28.40%",
          "chgp": "4.05%",
          "chgp_class": "positive"
        }
      ]
    }
  },
  {
    "link": "annual",
    "btn_text": "All Annual Results",
    "header": "Annual Results Snapshot (Consolidated) - Mar'26",
    "rhs": [
      {
        "prefix": "Net Sales ",
        "suffix": "YoY Growth in year ended Mar 2026 is 22.56% vs 20.03% in Mar 2025",
        "dir": 1
      },
      {
        "prefix": "Consolidated Net Profit ",
        "suffix": "YoY Growth in year ended Mar 2026 is 58.02% vs 33.81% in Mar 2025",
        "dir": 1
      }
    ],
    "table": {
      "header": [
        "Mar'26",
        "Mar'25",
        "Change(%)"
      ],
      "body": [
        {
          "field": "Net Sales",
          "val1": "5,690.45",
          "val2": "4,642.85",
          "chgp": "22.56%",
          "chgp_class": "positive"
        },
        {
          "field": "Operating Profit (PBDIT) excl Other Income",
          "val1": "1,787.43",
          "val2": "1,237.35",
          "chgp": "44.46%",
          "chgp_class": "positive"
        },
        {
          "field": "Interest",
          "val1": "244.46",
          "val2": "220.20",
          "chgp": "11.02%",
          "chgp_class": "negative"
        },
        {
          "field": "Exceptional Items",
          "val1": "10.24",
          "val2": "-0.36",
          "chgp": "2,944.44%",
          "chgp_class": "positive"
        },
        {
          "field": "Consolidate Net Profit",
          "val1": "1,105.86",
          "val2": "699.82",
          "chgp": "58.02%",
          "chgp_class": "positive"
        },
        {
          "field": "Operating Profit Margin (Excl OI)",
          "val1": "31.67%",
          "val2": "26.87%",
          "chgp": "4.80%",
          "chgp_class": "positive"
        }
      ]
    }
  }
]

Quarterly Results Snapshot (Consolidated) - Mar'26 - YoYstock-summary

Mar'26
Mar'25
Change(%)
Net Sales
1,253.57
1,238.84
1.19%
Operating Profit (PBDIT) excl Other Income
347.56
270.60
28.44%
Interest
53.53
70.03
-23.56%
Exceptional Items
0.00
-0.36
100.00%
Consolidate Net Profit
157.99
108.29
45.90%
Operating Profit Margin (Excl OI)
28.02%
22.00%
6.02%
Values in Rs Cr.
Direction Arrows
Net Sales

YoY Growth in quarter ended Mar 2026 is 1.19% vs 39.31% in Mar 2025

Direction Arrows
Consolidated Net Profit

YoY Growth in quarter ended Mar 2026 is 45.90% vs 14.74% in Mar 2025

Half Yearly Results Snapshot (Consolidated) - Sep'25stock-summary

Sep'25
Sep'24
Change(%)
Net Sales
3,160.89
2,084.87
51.61%
Operating Profit (PBDIT) excl Other Income
1,129.03
597.85
88.85%
Interest
126.59
90.50
39.88%
Exceptional Items
0.00
0.00
Consolidate Net Profit
757.54
394.16
92.19%
Operating Profit Margin (Excl OI)
35.93%
28.95%
6.98%
Values in Rs Cr.
Direction Arrows
Net Sales

Growth in half year ended Sep 2025 is 51.61% vs 1.53% in Sep 2024

Direction Arrows
Consolidated Net Profit

Growth in half year ended Sep 2025 is 92.19% vs 26.55% in Sep 2024

Nine Monthly Results Snapshot (Consolidated) - Dec'25stock-summary

Dec'25
Dec'24
Change(%)
Net Sales
4,436.88
3,404.01
30.34%
Operating Profit (PBDIT) excl Other Income
1,439.86
966.74
48.94%
Interest
190.93
154.70
23.42%
Exceptional Items
10.24
0.00
Consolidate Net Profit
947.91
591.52
60.25%
Operating Profit Margin (Excl OI)
32.45%
28.40%
4.05%
Values in Rs Cr.
Direction Arrows
Net Sales

YoY Growth in nine months ended Dec 2025 is 30.34% vs 14.27% in Dec 2024

Direction Arrows
Consolidated Net Profit

YoY Growth in nine months ended Dec 2025 is 60.25% vs 38.00% in Dec 2024

Annual Results Snapshot (Consolidated) - Mar'26stock-summary

Mar'26
Mar'25
Change(%)
Net Sales
5,690.45
4,642.85
22.56%
Operating Profit (PBDIT) excl Other Income
1,787.43
1,237.35
44.46%
Interest
244.46
220.20
11.02%
Exceptional Items
10.24
-0.36
2,944.44%
Consolidate Net Profit
1,105.86
699.82
58.02%
Operating Profit Margin (Excl OI)
31.67%
26.87%
4.80%
Values in Rs Cr.
Direction Arrows
Net Sales

YoY Growth in year ended Mar 2026 is 22.56% vs 20.03% in Mar 2025

Direction Arrows
Consolidated Net Profit

YoY Growth in year ended Mar 2026 is 58.02% vs 33.81% in Mar 2025

stock-summaryCompany CV
About Sarda Energy & Minerals Ltd stock-summary
stock-summary
Sarda Energy & Minerals Ltd
Small Cap
Ferrous Metals
Sarda Energy & Minerals Limited (Formerly known as Raipur Alloys & Steel Ltd) was established on June 23, 1976. Led by the Tejpaul Group, the Company has integrated steel manufacturing unit with facilities, ferro alloys backed by captive thermal power plant and is presently, engaged in metal, mining and power sector. It operates in the hydropower projects through SPVs. Later, the name of the Company was changed to Sarda Energy & Minerals Limited from Raipur Alloys & Steel Limited in 2006.
Company Coordinates stock-summary
Company Details
73/A, Central Avenue Nagpur Maharashtra : 440018
stock-summary
Tel: 91-0712-2722407
stock-summary
info@seml.co.in
Registrar Details
Bigshare Services Pvt Ltd , E-2 , Ansa Industrial Estate, Saki Vihar Road, Saki Naka, Andheri (E), Mumbai