Kirl. Ferrous

  • Market Cap: Small Cap
  • Industry: Ferrous Metals
  • ISIN: INE884B01025
  • NSEID: KIRLFER
  • BSEID: 500245
INR
452.20
2.35 (0.52%)
BSENSE

Aug 31, 03:30 PM

BSE+NSE Vol: 82.13 k

  • Price Points
  • Score
  • Mojo Parameters
  • Total Return
  • News and Corporate Actions
  • Key factors
  • Shareholding
  • Financials
  • CompanyCV
stock-summaryPrice Point
High/Low

1Day

52 Week

Valuation
Technical
Day's Volume

CASH

82.13 k (76.14%) Volume

Shareholding (Jun 2026)

FII

1.68%

Held by 93 FIIs

DII

12.56%

Held by 14 DIIs

Promoter

50.78%

Why is Kirloskar Ferrous Industries Ltd falling/rising?

31-Aug-2026

As of 30-Aug, Kirloskar Ferrous Industries Ltd's stock is rising slightly to 448.85, despite a 6.36% decline over the past month and a 17.09% drop over the past year. While it shows short-term positive trends and strong debt servicing ability, the long-term outlook is concerning due to declining operating profit growth.

As of 30-Aug, Kirloskar Ferrous Industries Ltd's stock price is currently rising, as indicated by a change of 1.2 (0.27%) to a current price of 448.85. This increase occurs despite a challenging performance over the past month, where the stock has declined by 6.36%, and a more significant drop of 17.09% over the past year. <BR><BR>The stock's performance today is described as inline with the sector, and it is trading above its 5-day, 20-day, 100-day, and 200-day moving averages, although it remains below the 50-day moving average. This suggests a short-term positive trend, even as investor participation has decreased significantly, with delivery volume falling by 81.72% against the 5-day average.<BR><BR>Additionally, the company demonstrates a strong ability to service its debt, evidenced by a low Debt to EBITDA ratio of 1.23 times and an attractive valuation with a return on capital employed (ROCE) of 12. The stock is trading at a discount compared to its peers' average historical valuations, which may attract some investors despite its recent poor performance.<BR><BR>However, the long-term outlook remains concerning, as the company has experienced a decline in operating profit growth over the last five years and has reported flat results in its most recent quarter. The combination of these factors indicates that while there may be short-term gains, the overall trend reflects ongoing challenges for Kirloskar Ferrous Industries Ltd.

View full answer

Should I buy, sell or hold Kirloskar Ferrous Industries Ltd?

20-Aug-2026

Who are in the management team of Kirl. Ferrous?

14-Aug-2026

The management team of Kirl. Ferrous includes Atul C Kirloskar (Chairman), R V Gumaste (Managing Director), and several directors, including independent members, totaling 14 key individuals who provide diverse expertise and leadership.

The management team of Kirl. Ferrous includes the following members:<BR><BR>1. **Atul C Kirloskar** - Chairman (Non-Executive)<BR>2. **R V Gumaste** - Managing Director<BR>3. **A N Alawani** - Director<BR>4. **Rahul C Kirloskar** - Vice Chairman<BR>5. **Nalini Venkatesh** - Independent Director<BR>6. **Yashwant Shripad Bhave** - Independent Director<BR>7. **Mahesh R Chhabria** - Director<BR>8. **Mayuresh Gharpure** - Company Secretary & Compliance Officer<BR>9. **Vijaydipak Mukundprasad Varma** - Independent Director<BR>10. **M V Kotwal** - Independent Director<BR>11. **Venkataramani Sathya Moorthy** - Independent Director<BR>12. **R. S. Srivatsan** - Executive Director (Finance) & CFO<BR>13. **Pravir Vohra** - Independent Director<BR>14. **Shalini Sarin** - Independent Director<BR><BR>This team brings a diverse range of expertise and leadership to the company.

View full answer

What does Kirl. Ferrous do?

14-Aug-2026

Kirloskar Ferrous Industries Ltd specializes in manufacturing iron casting products and is part of the small-cap ferrous metals industry. As of June 2026, it reported net sales of ₹1,772 Cr and a net profit of ₹82 Cr, with a market cap of ₹7,215 Cr.

Overview: <BR>Kirloskar Ferrous Industries Ltd is a pioneer in manufacturing iron casting products and operates within the small-cap ferrous metals industry.<BR><BR>History: <BR>The company was incorporated on September 10, 1991. It is the flagship company of the Kirloskar Group, which was promoted by Kirloskar Oil Engines Limited and Shivaji Works Limited, the latter of which subsequently merged with Kirloskar Oil Engines Limited. The most recent quarterly results reported net sales and net profit for June 2026.<BR><BR>Financial Snapshot: <BR>- Net Sales: 1,772 Cr (Quarterly Results - Jun 2026) <BR>- Net Profit: 82 Cr (Quarterly Results - Jun 2026) <BR>- Market Cap: INR 7,215 Cr (Small Cap) <BR><BR>Key Metrics: <BR>- P/E: 19.00 <BR>- Industry P/E: 24 <BR>- Dividend Yield: 1.38% <BR>- Debt Equity: 0.24 <BR>- Return on Equity: 13.33% <BR>- Price to Book: 1.86 <BR><BR>Contact Details: <BR>Address: 13 Laxmanrao Kirloskar Road, Khadki Pune Maharashtra : 411003 <BR>Tel: 91-20-66084664 <BR>Email: investor@kfil.com <BR>Website: http://www.kfil.com

View full answer

Who are the peers of the Kirl. Ferrous?

14-Aug-2026

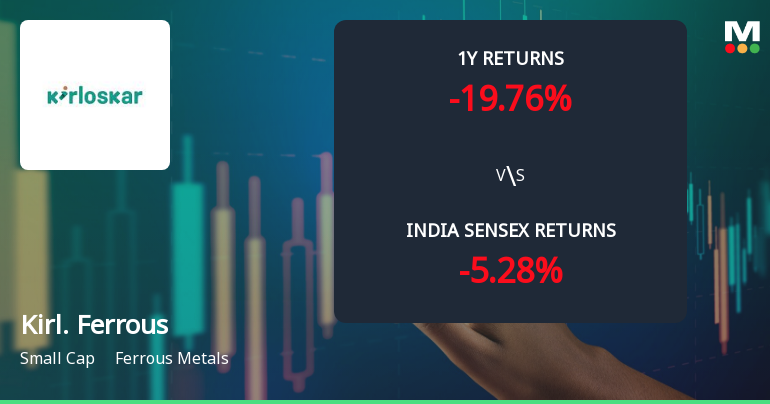
Kirl. Ferrous's peers include KIOCL, Sarda Energy, NMDC Steel, Indian Metals, Sunflag Iron, Jai Balaji Inds., Maithan Alloys, Prakash Industri, and Mukand. Kirl. Ferrous has below-average growth and management risk, with a 1-year return of -19.74%, significantly lower than its peers, while Indian Metals leads with an 80.14% return.

Peers: The peers of Kirl. Ferrous are KIOCL, Sarda Energy, NMDC Steel, Indian Metals, Sunflag Iron, Jai Balaji Inds., Maithan Alloys, Prakash Industri, and Mukand.<BR><BR>Quality Snapshot: Excellent management risk is observed at Sarda Energy and Jai Balaji Inds., while Average management risk is found at KIOCL, NMDC Steel, Indian Metals, Sunflag Iron, and Maithan Alloys, and the rest. Below Average management risk is present at Prakash Industri and Mukand. Growth is Excellent at NMDC Steel and Jai Balaji Inds., Good at Sarda Energy and Sunflag Iron, Below Average at Kirl. Ferrous, Indian Metals, Maithan Alloys, and the rest, and Below Average at KIOCL and Prakash Industri. Capital Structure is Excellent at Indian Metals and Maithan Alloys, Good at Kirl. Ferrous, Sarda Energy, Sunflag Iron, and the rest, and Below Average at KIOCL, NMDC Steel, and Mukand.<BR><BR>Return Snapshot: The peer with the highest 1-year return is Indian Metals at 80.14%, while Kirl. Ferrous has the lowest at -19.74%. Kirl. Ferrous's return is significantly lower than its peers. Additionally, KIOCL, Indian Metals, Kirl. Ferrous, Jai Balaji Inds., Prakash Industri, and Mukand all have negative six-month returns.

View full answer

How big is Kirl. Ferrous?

14-Aug-2026

As of 14th August, Kirloskar Ferrous Industries Ltd has a market capitalization of 7,162.22 Cr, with recent net sales of 6,961.99 Cr and a net profit of 349.34 Cr over the latest four quarters.

As of 14th August, <BR><BR>Market Cap: Kirloskar Ferrous Industries Ltd has a market capitalization of 7,162.22 Cr and is classified as a Small Cap company.<BR><BR>Recent Quarterly Performance: The sum of Net Sales for the latest 4 quarters is 6,961.99 Cr, while the sum of Net Profit for the same period is 349.34 Cr.<BR><BR>Balance Sheet Snapshot: The reporting period for the balance sheet is March 2026. Shareholder's Funds stand at 3,862.79 Cr, and Total Assets amount to 6,589.04 Cr.

View full answer

Are Kirloskar Ferrous Industries Ltd latest results good or bad?

06-Aug-2026

Kirloskar Ferrous Industries Ltd's latest results are concerning, showing a 4.32% revenue growth but a significant 65.40% decline in net profit, leading to a drop in profit margin from 14.01% to 4.65%. Overall, the results indicate operational challenges and poor profitability, categorizing them as bad.

The latest results for Kirloskar Ferrous Industries Ltd indicate a challenging quarter. While the company experienced a revenue growth of 4.32% year-on-year, reaching ₹1,771.51 crores, its net profit saw a significant decline of 65.40% year-on-year, dropping to ₹82.34 crores. This sharp decrease in profitability is concerning, especially given that the profit margin (PAT margin) fell dramatically from 14.01% in the previous year to just 4.65%.<BR><BR>Additionally, there was a quarter-on-quarter decline in net profit of 34.48%, alongside a revenue contraction of 2.51%. This suggests that the company is facing operational challenges and cost pressures that are impacting its ability to convert sales into profits effectively.<BR><BR>Overall, the results reflect a troubling disconnect between top-line growth and bottom-line performance, raising questions about the company's operational efficiency and profitability sustainability in a competitive market. Therefore, the latest results can be characterized as bad, primarily due to the severe profit decline and margin compression.

View full answer

Has Kirloskar Ferrous Industries Ltd declared dividend?

12-Feb-2026

Yes, Kirloskar Ferrous Industries Ltd has declared a dividend of 60% (₹2.5 per share) with an ex-date of February 16, 2026. While recent returns have been negative, the company has shown substantial long-term growth, with a total return of 187.06% over the past 5 years.

Kirloskar Ferrous Industries Ltd has declared a dividend.<BR><BR>Dividend Details:<BR>- Percentage announced: 60%<BR>- Amount per share: 2.5<BR>- Ex-date: 16 Feb 26<BR><BR>Dividend Yield: 1.22%.<BR><BR>Total Returns by Period:<BR>In the last 3 months, the price return was -7.41%, the dividend return was 0.63%, resulting in a total return of -6.78%.<BR><BR>Over the last 6 months, the price return was -19.91%, the dividend return was 0.55%, leading to a total return of -19.36%.<BR><BR>For the 1-year period, the price return was -11.04%, with a dividend return of 1.12%, culminating in a total return of -9.92%.<BR><BR>In the 2-year period, the price return was -24.22%, the dividend return was 1.96%, resulting in a total return of -22.26%.<BR><BR>During the 3-year period, the price return was 18.52%, with a dividend return of 3.34%, resulting in a total return of 21.86%.<BR><BR>In the last 4 years, the price return was 116.18%, the dividend return was 10.64%, leading to a total return of 126.82%.<BR><BR>Over the 5-year period, the price return was 173.34%, with a dividend return of 13.72%, resulting in a total return of 187.06%.<BR><BR>Overall, Kirloskar Ferrous Industries Ltd has declared a significant dividend, and while recent returns over shorter periods have been negative, the long-term performance shows substantial growth in both price and dividends.

View full answer

Is Kirl. Ferrous overvalued or undervalued?

05-Dec-2025

As of December 4, 2025, Kirl. Ferrous is fairly valued with a PE ratio of 23.50, an EV to EBITDA of 11.02, and a dividend yield of 1.18%, but has underperformed the Sensex with a year-to-date return of -27.28%.

As of 4 December 2025, Kirl. Ferrous has moved from an attractive to a fair valuation grade. The company is currently fairly valued based on its financial metrics. Key ratios include a PE ratio of 23.50, an EV to EBITDA of 11.02, and a dividend yield of 1.18%. <BR><BR>In comparison to its peers, Kirl. Ferrous has a lower PE ratio than JSW Steel, which stands at 45.91, and a higher EV to EBITDA than Tata Steel at 10.26. The company's recent stock performance has lagged behind the Sensex, with a year-to-date return of -27.28% compared to the Sensex's 9.12%, reinforcing the notion of its fair valuation amidst current market conditions.

View full answer

How has been the historical performance of Kirl. Ferrous?

17-Nov-2025

Kirl. Ferrous has shown mixed historical performance over the past four years, with net sales increasing to 6,564.23 Cr in March 2025, but profitability metrics like operating profit and profit before tax declined due to rising expenditures. Total assets grew to 6,348.72 Cr, while cash flow from operating activities improved, indicating challenges in cost management.

Answer:<BR>The historical performance of Kirl. Ferrous shows a mixed trend over the past four years, with notable fluctuations in key financial metrics.<BR><BR>Breakdown:<BR>Kirl. Ferrous reported net sales of 6,564.23 Cr in March 2025, an increase from 6,146.29 Cr in March 2024, following a dip from 6,417.45 Cr in March 2023. The total operating income mirrored this trend, reaching 6,564.23 Cr in March 2025. However, total expenditure also rose to 5,808.05 Cr in March 2025 from 5,283.71 Cr in March 2024, impacting the operating profit, which decreased to 808.76 Cr from 875.94 Cr. Profit before tax fell to 408.49 Cr in March 2025 from 452.90 Cr in March 2024, while profit after tax slightly decreased to 294.04 Cr from 297.66 Cr. The company's total assets increased to 6,348.72 Cr in March 2025 from 5,894.50 Cr in March 2024, with total liabilities also rising to 6,348.72 Cr. Cash flow from operating activities improved to 654.00 Cr in March 2025 from 562.00 Cr in March 2024, although cash flow from investing activities remained negative at -474.00 Cr. Overall, while Kirl. Ferrous experienced growth in sales and assets, profitability metrics showed a decline, indicating challenges in managing costs and expenses.

View full answer

Is Kirl. Ferrous technically bullish or bearish?

10-Nov-2025

As of November 7, 2025, the technical trend has shifted to a bearish stance, indicated by bearish MACD, Bollinger Bands, and KST readings, along with underperformance against the Sensex.

As of 7 November 2025, the technical trend has changed from mildly bearish to bearish. The current stance is bearish with a strong indication of weakness. Key indicators driving this include a bearish MACD on both the weekly and monthly time frames, bearish Bollinger Bands, and bearish KST readings. The daily moving averages also confirm a bearish trend. Additionally, the stock has underperformed significantly compared to the Sensex over multiple time frames, further reinforcing the bearish outlook.

View full answer

Who are the top shareholders of the Kirl. Ferrous?

06-Jun-2025

The top shareholder of Kirl. Ferrous is Kirloskar Industries Limited, holding 46.01%. Other significant shareholders include mutual funds (10.07%), HDFC Small Cap Fund (4.8%), and individual investors (21.69%), with no pledged promoter holdings reported.

The top shareholders of Kirl. Ferrous include Kirloskar Industries Limited, which holds the largest stake at 46.01%. The company also has a diverse range of shareholders, including mutual funds, which collectively hold 10.07% through 12 different schemes. Additionally, 91 foreign institutional investors (FIIs) own 1.92% of the company. The highest public shareholder is HDFC Small Cap Fund, with a holding of 4.8%. Individual investors collectively hold 21.69% of the shares. Overall, the majority of the shares are held by promoters, with no pledged promoter holdings reported.

View full answer

When is the next results date for Kirl. Ferrous?

06-Jun-2025

No Upcoming Board Meetings

iScoreScore
Click here to find our call on this stock
Strong Sell
Sell
Hold
Buy
Strong Buy

Dashboard

1

Poor long term growth as Operating profit has grown by an annual rate -6.28% of over the last 5 years

 
2

Flat results in Jun 26

stock-summaryMojo Parameters

Mojo Parameters

Loading Valuation Snapshot...

Stock DNA

stock-summary
Industry

Ferrous Metals

stock-summary
Market cap

INR 7,378 Cr (Small Cap)

stock-summary
P/E

19.00

stock-summary
Industry P/E

25

stock-summary
Dividend Yield

1.33%

stock-summary
Debt Equity

0.24

stock-summary
Return on Equity

13.33%

stock-summary
Price to Book

1.92

Revenue and Profits:
Net Sales:
1,772 Cr
(Quarterly Results - Jun 2026)
Net Profit:
82 Cr
stock-summaryTotal Returns
Total Returns (Price + Dividend) stock-summary
Dividend Yield (1.33%)
TimePeriod
Price Return
Dividend Return
Total Return
3 Months
3.93%
0.70%
4.63%
6 Months
0%
0%
0.0%
1 Year
0%
0%
0.0%
2 Years
0%
0%
0.0%
3 Years
-4.44%
3.17%
-1.27%
4 Years
78.0%
7.82%
85.82%
5 Years
85.67%
10.58%
96.25%

Latest dividend: 2.9999999999999996 per share ex-dividend date: Jul-17-2026

Risk Adjusted Returns v/s stock-summary
Returns Beta
Icon
Beta has not been calculated since enough price history is not available
stock-summaryNews & Corporate Actions

News

stock-summaryKey Factors

Quality key factors stock-summary

Factor
Value
Sales Growth (5y)
2.71%
EBIT Growth (5y)
-6.28%
EBIT to Interest (avg)
4.91
Debt to EBITDA (avg)
2.67
Net Debt to Equity (avg)
0.24
Sales to Capital Employed (avg)
1.40
Tax Ratio
25.99%
Dividend Payout Ratio
19.51%
Pledged Shares
0
Institutional Holding
14.24%
ROCE (avg)
13.33%
ROE (avg)
12.90%

Valuation key factors

Factor
Value
P/E Ratio
19
Industry P/E
25
Price to Book Value
1.91
EV to EBIT
14.61
EV to EBITDA
9.88
EV to Capital Employed
1.74
EV to Sales
1.19
PEG Ratio
NA
Dividend Yield
1.34%
ROCE (Latest)
12.03%
ROE (Latest)
13.33%

Technicals key factors

Indicator
Weekly
Monthly
MACD
Mildly Bearish
Bearish
RSI
No Signal
No Signal
Bollinger Bands
Bearish
Bearish
Moving Averages
Mildly Bullish (Daily)
KST
Mildly Bearish
Bearish
Dow Theory
Mildly Bullish
Mildly Bullish
OBV
No Trend
Bullish
stock-summary Technical Indicator Scale: Bearish, Mildly Bearish, Sideways, Mildly Bullish, Bullish  Turned 
stock-summaryShareholding
Shareholding Snapshot : Jun 2026stock-summary
Shareholding Compare (%holding) stock-summary
Majority shareholders

Promoters

Pledged Promoter Holdings

None

Mutual Funds

Held by 13 Schemes (12.09%)

FIIs

Held by 93 FIIs (1.68%)

Promoter with highest holding

Kirloskar Industries Limited (45.91%)

Highest Public shareholder

Hdfc Small Cap Fund (4.79%)

Individual Investors Holdings

20.43%

stock-summaryFinancial
[
  {
    "link": "quarterly",
    "btn_text": "All Quarterly Results",
    "header": "Quarterly Results Snapshot (Consolidated) - Jun'26 - QoQ",
    "rhs": [
      {
        "prefix": "Net Sales ",
        "suffix": "QoQ Growth in quarter ended Jun 2026 is -2.51% vs 12.31% in Mar 2026",
        "dir": -1
      },
      {
        "prefix": "Consolidated Net Profit ",
        "suffix": "QoQ Growth in quarter ended Jun 2026 is -34.48% vs 128.34% in Mar 2026",
        "dir": -1
      }
    ],
    "table": {
      "header": [
        "Jun'26",
        "Mar'26",
        "Change(%)"
      ],
      "body": [
        {
          "field": "Net Sales",
          "val1": "1,771.51",
          "val2": "1,817.16",
          "chgp": "-2.51%",
          "chgp_class": "negative"
        },
        {
          "field": "Operating Profit (PBDIT) excl Other Income",
          "val1": "215.74",
          "val2": "224.56",
          "chgp": "-3.93%",
          "chgp_class": "negative"
        },
        {
          "field": "Interest",
          "val1": "29.47",
          "val2": "29.94",
          "chgp": "-1.57%",
          "chgp_class": "positive"
        },
        {
          "field": "Exceptional Items",
          "val1": "-29.33",
          "val2": "0.00",
          "chgp": "",
          "chgp_class": "neutral"
        },
        {
          "field": "Consolidate Net Profit",
          "val1": "82.34",
          "val2": "125.68",
          "chgp": "-34.48%",
          "chgp_class": "negative"
        },
        {
          "field": "Operating Profit Margin (Excl OI)",
          "val1": "12.18%",
          "val2": "12.36%",
          "chgp": "-0.18%",
          "chgp_class": "negative"
        }
      ]
    }
  },
  {
    "link": "half-yearly",
    "btn_text": "All Half Yearly Results",
    "header": "Half Yearly Results Snapshot (Consolidated) - Sep'25",
    "rhs": [
      {
        "prefix": "Net Sales ",
        "suffix": " Growth in half year ended Sep 2025 is 7.26% vs 5.14% in Sep 2024",
        "dir": 1
      },
      {
        "prefix": "Consolidated Net Profit ",
        "suffix": " Growth in half year ended Sep 2025 is 23.08% vs -15.59% in Sep 2024",
        "dir": 1
      }
    ],
    "table": {
      "header": [
        "Sep'25",
        "Sep'24",
        "Change(%)"
      ],
      "body": [
        {
          "field": "Net Sales",
          "val1": "3,453.40",
          "val2": "3,219.68",
          "chgp": "7.26%",
          "chgp_class": "positive"
        },
        {
          "field": "Operating Profit (PBDIT) excl Other Income",
          "val1": "431.28",
          "val2": "381.10",
          "chgp": "13.17%",
          "chgp_class": "positive"
        },
        {
          "field": "Interest",
          "val1": "66.59",
          "val2": "70.18",
          "chgp": "-5.12%",
          "chgp_class": "positive"
        },
        {
          "field": "Exceptional Items",
          "val1": "2.51",
          "val2": "0.00",
          "chgp": "",
          "chgp_class": "neutral"
        },
        {
          "field": "Consolidate Net Profit",
          "val1": "181.40",
          "val2": "147.38",
          "chgp": "23.08%",
          "chgp_class": "positive"
        },
        {
          "field": "Operating Profit Margin (Excl OI)",
          "val1": "12.49%",
          "val2": "11.84%",
          "chgp": "0.65%",
          "chgp_class": "positive"
        }
      ]
    }
  },
  {
    "link": "nine-monthly",
    "btn_text": "All Nine Monthly Results",
    "header": "Nine Monthly Results Snapshot (Consolidated) - Dec'25",
    "rhs": [
      {
        "prefix": "Net Sales ",
        "suffix": "YoY Growth in nine months ended Dec 2025 is 5.06% vs 4.70% in Dec 2024",
        "dir": 1
      },
      {
        "prefix": "Consolidated Net Profit ",
        "suffix": "YoY Growth in nine months ended Dec 2025 is 17.23% vs -27.95% in Dec 2024",
        "dir": 1
      }
    ],
    "table": {
      "header": [
        "Dec'25",
        "Dec'24",
        "Change(%)"
      ],
      "body": [
        {
          "field": "Net Sales",
          "val1": "5,071.41",
          "val2": "4,827.28",
          "chgp": "5.06%",
          "chgp_class": "positive"
        },
        {
          "field": "Operating Profit (PBDIT) excl Other Income",
          "val1": "617.17",
          "val2": "554.90",
          "chgp": "11.22%",
          "chgp_class": "positive"
        },
        {
          "field": "Interest",
          "val1": "95.43",
          "val2": "109.06",
          "chgp": "-12.50%",
          "chgp_class": "positive"
        },
        {
          "field": "Exceptional Items",
          "val1": "-15.15",
          "val2": "0.00",
          "chgp": "",
          "chgp_class": "neutral"
        },
        {
          "field": "Consolidate Net Profit",
          "val1": "236.44",
          "val2": "201.69",
          "chgp": "17.23%",
          "chgp_class": "positive"
        },
        {
          "field": "Operating Profit Margin (Excl OI)",
          "val1": "12.17%",
          "val2": "11.50%",
          "chgp": "0.67%",
          "chgp_class": "positive"
        }
      ]
    }
  },
  {
    "link": "annual",
    "btn_text": "All Annual Results",
    "header": "Annual Results Snapshot (Consolidated) - Mar'26",
    "rhs": [
      {
        "prefix": "Net Sales ",
        "suffix": "YoY Growth in year ended Mar 2026 is 4.94% vs 6.80% in Mar 2025",
        "dir": -1
      },
      {
        "prefix": "Consolidated Net Profit ",
        "suffix": "YoY Growth in year ended Mar 2026 is 72.51% vs -1.26% in Mar 2025",
        "dir": 1
      }
    ],
    "table": {
      "header": [
        "Mar'26",
        "Mar'25",
        "Change(%)"
      ],
      "body": [
        {
          "field": "Net Sales",
          "val1": "6,888.57",
          "val2": "6,564.23",
          "chgp": "4.94%",
          "chgp_class": "positive"
        },
        {
          "field": "Operating Profit (PBDIT) excl Other Income",
          "val1": "841.72",
          "val2": "756.18",
          "chgp": "11.31%",
          "chgp_class": "positive"
        },
        {
          "field": "Interest",
          "val1": "125.37",
          "val2": "144.44",
          "chgp": "-13.20%",
          "chgp_class": "positive"
        },
        {
          "field": "Exceptional Items",
          "val1": "-15.15",
          "val2": "0.00",
          "chgp": "",
          "chgp_class": "neutral"
        },
        {
          "field": "Consolidate Net Profit",
          "val1": "507.22",
          "val2": "294.03",
          "chgp": "72.51%",
          "chgp_class": "positive"
        },
        {
          "field": "Operating Profit Margin (Excl OI)",
          "val1": "12.22%",
          "val2": "11.52%",
          "chgp": "0.70%",
          "chgp_class": "positive"
        }
      ]
    }
  }
]

Quarterly Results Snapshot (Consolidated) - Jun'26 - QoQstock-summary

Jun'26
Mar'26
Change(%)
Net Sales
1,771.51
1,817.16
-2.51%
Operating Profit (PBDIT) excl Other Income
215.74
224.56
-3.93%
Interest
29.47
29.94
-1.57%
Exceptional Items
-29.33
0.00
Consolidate Net Profit
82.34
125.68
-34.48%
Operating Profit Margin (Excl OI)
12.18%
12.36%
-0.18%
Values in Rs Cr.
Direction Arrows
Net Sales

QoQ Growth in quarter ended Jun 2026 is -2.51% vs 12.31% in Mar 2026

Direction Arrows
Consolidated Net Profit

QoQ Growth in quarter ended Jun 2026 is -34.48% vs 128.34% in Mar 2026

Half Yearly Results Snapshot (Consolidated) - Sep'25stock-summary

Sep'25
Sep'24
Change(%)
Net Sales
3,453.40
3,219.68
7.26%
Operating Profit (PBDIT) excl Other Income
431.28
381.10
13.17%
Interest
66.59
70.18
-5.12%
Exceptional Items
2.51
0.00
Consolidate Net Profit
181.40
147.38
23.08%
Operating Profit Margin (Excl OI)
12.49%
11.84%
0.65%
Values in Rs Cr.
Direction Arrows
Net Sales

Growth in half year ended Sep 2025 is 7.26% vs 5.14% in Sep 2024

Direction Arrows
Consolidated Net Profit

Growth in half year ended Sep 2025 is 23.08% vs -15.59% in Sep 2024

Nine Monthly Results Snapshot (Consolidated) - Dec'25stock-summary

Dec'25
Dec'24
Change(%)
Net Sales
5,071.41
4,827.28
5.06%
Operating Profit (PBDIT) excl Other Income
617.17
554.90
11.22%
Interest
95.43
109.06
-12.50%
Exceptional Items
-15.15
0.00
Consolidate Net Profit
236.44
201.69
17.23%
Operating Profit Margin (Excl OI)
12.17%
11.50%
0.67%
Values in Rs Cr.
Direction Arrows
Net Sales

YoY Growth in nine months ended Dec 2025 is 5.06% vs 4.70% in Dec 2024

Direction Arrows
Consolidated Net Profit

YoY Growth in nine months ended Dec 2025 is 17.23% vs -27.95% in Dec 2024

Annual Results Snapshot (Consolidated) - Mar'26stock-summary

Mar'26
Mar'25
Change(%)
Net Sales
6,888.57
6,564.23
4.94%
Operating Profit (PBDIT) excl Other Income
841.72
756.18
11.31%
Interest
125.37
144.44
-13.20%
Exceptional Items
-15.15
0.00
Consolidate Net Profit
507.22
294.03
72.51%
Operating Profit Margin (Excl OI)
12.22%
11.52%
0.70%
Values in Rs Cr.
Direction Arrows
Net Sales

YoY Growth in year ended Mar 2026 is 4.94% vs 6.80% in Mar 2025

Direction Arrows
Consolidated Net Profit

YoY Growth in year ended Mar 2026 is 72.51% vs -1.26% in Mar 2025

stock-summaryCompany CV
About Kirloskar Ferrous Industries Ltd stock-summary
stock-summary
Kirloskar Ferrous Industries Ltd
Small Cap
Ferrous Metals
Kirloskar Ferrous Industries Limited (KFIL) was incorporated on September 10, 1991, a flagship Company of Kirloskar Group, promoted by Kirloskar Oil Engines Limited and Shivaji Works Limited. Shivaji Works Limited subsequently merged with Kirloskar Oil Engines Limited. The erstwhile company, Kirloskar Oil Engines Limited now changed its name to Kirloskar Industries Limited. The Company is a pioneer in manufacturing of iron casting products.
Company Coordinates stock-summary
Company Details
13 Laxmanrao Kirloskar Road, Khadki Pune Maharashtra : 411003
stock-summary
Tel: 91-20-66084664
stock-summary
investor@kfil.com
Registrar Details
Link Intime India Pvt Ltd, Block No 202, 2nd Floor, Akshay Complex, Near Ganesh Temple, Off Dhole Patil Road , Pune