
Compare Kirloskar Oil with Similar Stocks
Stock DNA
Compressors, Pumps & Diesel Engines
INR 34,194 Cr (Small Cap)
59.00
57
0.29%
1.05
16.43%
9.10
Total Returns (Price + Dividend) 
Latest dividend: 2.5086879432624114 per share ex-dividend date: Feb-20-2026
Risk Adjusted Returns v/s
Returns Beta

News
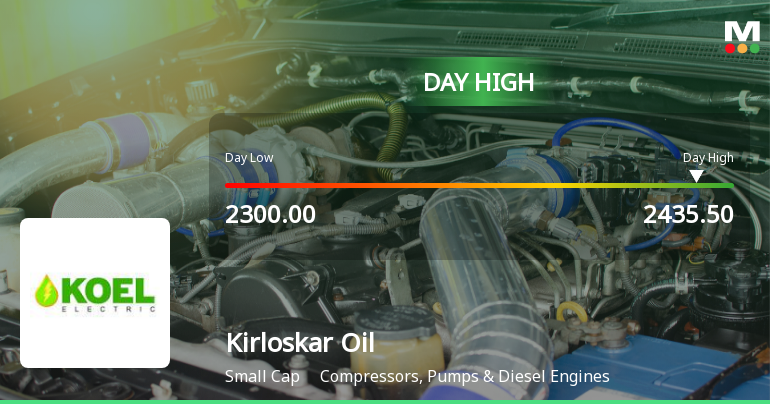
Kirloskar Oil Engines Ltd Surges 7.07% to Day's High of Rs 2435.5 — Outperforms Sector by 5.31 Percentage Points
The Sensex advanced 0.31% on 9 Jul 2026, yet Kirloskar Oil Engines Ltd outpaced the broader market with a 7.07% gain, touching an intraday high of Rs 2435.5. This 5.31-percentage-point outperformance over its sector underscores a distinctly stock-specific rally rather than a market-wide lift.
Read full news article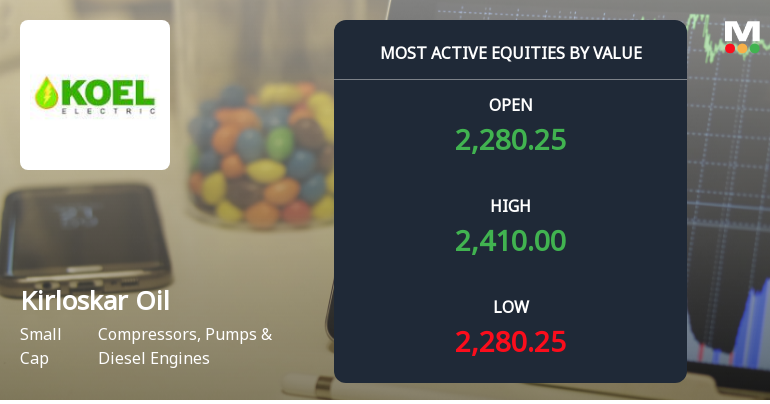
Kirloskar Oil Engines Ltd Sees Robust Trading Activity Amid Positive Momentum
Kirloskar Oil Engines Ltd (KIRLOSENG) has emerged as one of the most actively traded stocks by value on 6 July 2026, registering a robust 4.16% gain and attracting significant institutional interest. The small-cap player in the Compressors, Pumps & Diesel Engines sector demonstrated a notable reversal after six consecutive days of decline, signalling renewed investor confidence and a potential shift in market sentiment.
Read full news article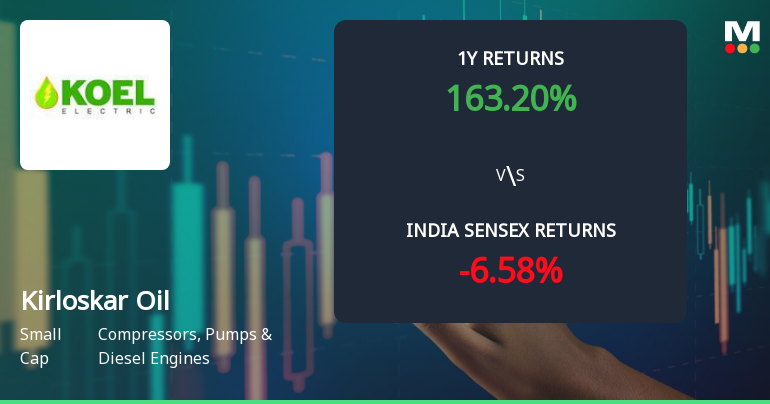
Kirloskar Oil Engines Ltd Technical Momentum Shifts Signal Bullish Outlook
Kirloskar Oil Engines Ltd has experienced a notable shift in its technical momentum, upgrading from a mildly bullish to a bullish stance, supported by robust long-term returns that significantly outperform the Sensex. Despite a recent day decline of 3.85%, the stock’s technical indicators and fundamental performance suggest a positive outlook for investors in the compressors, pumps and diesel engines sector.
Read full news article Announcements
Kirloskar Oil Engines Limited - Other General Purpose
22-Nov-2019 | Source : NSEKirloskar Oil Engines Limited has informed the Exchange regarding Disclosure of Related Party Transaction disclosure under Regulation 23(9) of the SEBI (Listing Obligations and Disclosure Requirements) Regulations, 2015.
Kirloskar Oil Engines Limited - Updates
25-Oct-2019 | Source : NSEKirloskar Oil Engines Limited has informed the Exchange regarding 'Pursuant to Regulation 47 of the SEBI (Listing Obligations and Disclosure Requirements) Regulations, 2015, please find enclosed herewith copies of the Standalone and Consolidated Un-audited Financial Results of the Company for the quarter and half year ended 30 September 2019, published in the Newspapers (Financial Express and Loksatta) on 25 October 2019.
Kirloskar Oil Engines Limited - Analysts/Institutional Investor Meet/Con. Call Updates
22-Oct-2019 | Source : NSEKirloskar Oil Engines Limited has informed the Exchange regarding Analysts/Institutional Investor Meet/Con. Call Updates
Corporate Actions

No Upcoming Board Meetings

Kirloskar Oil Engines Ltd has declared 225% dividend, ex-date: 31 Jul 26

No Splits history available

No Bonus history available

No Rights history available
Quality key factors
Valuation key factors
Technicals key factors
 Technical Indicator Scale: Bearish, Mildly Bearish, Sideways, Mildly Bullish, Bullish Turned
 Shareholding Snapshot : Mar 2026
Shareholding Compare (%holding)
Promoters
None
Held by 30 Schemes (24.87%)
Held by 161 FIIs (10.79%)
Rahul Chandrakant Kirloskar As Individual, As A Karta Of Rahul C. Kirloskar Huf And As A Trustee Of (12.24%)
Dsp Small Cap Fund (5.92%)
15.82%
Quarterly Results Snapshot (Consolidated) - Mar'26 - QoQ

QoQ Growth in quarter ended Mar 2026 is 13.01% vs -3.89% in Dec 2025
QoQ Growth in quarter ended Mar 2026 is 42.40% vs -31.44% in Dec 2025
Half Yearly Results Snapshot (Consolidated) - Sep'25
Growth in half year ended Sep 2025 is 18.38% vs 10.10% in Sep 2024

Growth in half year ended Sep 2025 is 6.11% vs 40.94% in Sep 2024
Nine Monthly Results Snapshot (Consolidated) - Dec'25
YoY Growth in nine months ended Dec 2025 is 21.68% vs 8.26% in Dec 2024
YoY Growth in nine months ended Dec 2025 is 16.09% vs 22.09% in Dec 2024
Annual Results Snapshot (Consolidated) - Mar'60
Not Applicable: The company has declared_date for only one period
Not Applicable: The company has declared_date for only one period
About Kirloskar Oil Engines Ltd

Company Coordinates


