
Compare KSB with Similar Stocks
Dashboard
High Management Efficiency with a high ROE of 16.14%
The company is Net-Debt Free
Poor long term growth as Operating profit has grown by an annual rate 11.98% of over the last 5 years
With ROE of 17.2, it has a Very Expensive valuation with a 9.7 Price to Book Value
Majority shareholders : Promoters
Market Beating performance in long term as well as near term
With its market cap of Rs 16,260 cr, it is the second biggest company in the sector (behind Elgi Equipments)and constitutes 19.45% of the entire sector
Stock DNA
Compressors, Pumps & Diesel Engines
INR 16,196 Cr (Small Cap)
58.00
35
0.47%
-0.17
17.25%
9.69
Total Returns (Price + Dividend) 
Latest dividend: 4.400755364806868 per share ex-dividend date: May-08-2026
Risk Adjusted Returns v/s
Returns Beta

News
KSB Ltd is Rated Hold by MarketsMOJO
KSB Ltd is rated 'Hold' by MarketsMOJO, with this rating last updated on 08 June 2026. However, the analysis and financial metrics presented here reflect the stock's current position as of 01 July 2026, providing investors with the latest insights into the company’s performance and outlook.
Read full news article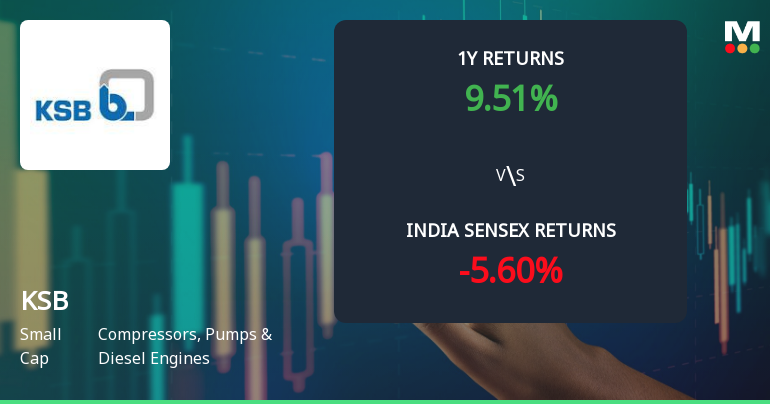
KSB Ltd Technical Momentum Shifts Signal Bullish Outlook Amid Strong Returns
KSB Ltd has demonstrated a notable shift in technical momentum, moving from a mildly bullish stance to a more confident bullish trend, supported by key indicators such as MACD, RSI, and moving averages. This technical evolution coincides with the company’s robust price performance, outpacing the Sensex across multiple timeframes and signalling renewed investor interest in this small-cap player within the Compressors, Pumps & Diesel Engines sector.
Read full news article
KSB Ltd is Rated Hold by MarketsMOJO
KSB Ltd is rated 'Hold' by MarketsMOJO, with this rating last updated on 08 June 2026. While the rating change occurred on that date, the analysis and financial metrics presented here reflect the company’s current position as of 20 June 2026, providing investors with the most up-to-date view of the stock’s fundamentals, returns, and technical outlook.
Read full news article Announcements
Name and Symbol Change
16-Oct-2018 | Source : NSE
| Members of the Exchange are hereby informed that the name and symbol of the company shall be changed from KSB Pumps Limited to KSB Limited and KSBPUMPS to KSB respectively w.e.f. October 23, 2018. |
Change in Director(s)
01-Oct-2018 | Source : NSE
| KSB Pumps Limited has informed the Exchange regarding Change in Director(s) of the company. |
Investor Presentation
24-Aug-2018 | Source : NSE
| KSB Pumps Limited has informed the Exchange regarding Investor Presentation |
Corporate Actions

No Upcoming Board Meetings

KSB Ltd has declared 220% dividend, ex-date: 08 May 26

KSB Ltd has announced 2:10 stock split, ex-date: 25 Jul 24

KSB Ltd has announced 1:1 bonus issue, ex-date: 18 Apr 11

No Rights history available
Quality key factors
Valuation key factors
Technicals key factors
 Technical Indicator Scale: Bearish, Mildly Bearish, Sideways, Mildly Bullish, Bullish Turned
 Shareholding Snapshot : Mar 2026
Shareholding Compare (%holding)
Promoters
None
Held by 21 Schemes (9.75%)
Held by 113 FIIs (4.66%)
Canadian Kay Pump Limited (40.54%)
Icici Prudential Infrastructure Fund (2.89%)
11.78%
Quarterly Results Snapshot (Consolidated) - Mar'26 - YoY

YoY Growth in quarter ended Mar 2026 is 0.99% vs 9.41% in Mar 2025
YoY Growth in quarter ended Mar 2026 is -22.87% vs 15.70% in Mar 2025
Half Yearly Results Snapshot (Consolidated) - Jun'25
Growth in half year ended Jun 2025 is 6.04% vs 10.11% in Jun 2024
Growth in half year ended Jun 2025 is 8.25% vs 8.68% in Jun 2024
Nine Monthly Results Snapshot (Consolidated) - Sep'25
YoY Growth in nine months ended Sep 2025 is 5.81% vs 9.86% in Sep 2024
YoY Growth in nine months ended Sep 2025 is 8.66% vs 13.39% in Sep 2024
Annual Results Snapshot (Consolidated) - Dec'25
YoY Growth in year ended Dec 2025 is 6.42% vs 12.72% in Dec 2024
YoY Growth in year ended Dec 2025 is 9.29% vs 18.59% in Dec 2024
About KSB Ltd

Company Coordinates


